Real Load Synthetic Monitoring Generally Available!
Performance testing as a main and synthetic monitoring as a dessert? Now available at Real Load.
Recently we’ve launched a new version of our Real Load portal which adds the ability to periodically monitor your applications. The best thing to it is that you can re-use already developed load testing scripts to periodically monitor your applications. It makes sense to re-use the same underlying technology for both tasks, correct?
And, of course, nobody forces you to have the main followed by the dessert. You can also first have the dessert (… synthetic monitoring) followed by the main (… load testing). Or perhaps the dessert is the main for you, you can arrange the menu as it best suits your taste.
How it works
As for load testing, you’ll first have to prepare your testing script. Let’s assume you’ve already prepared it using our Wizards. Once the script is ready, the only remaining thing to do is to schedule it for periodic execution.
Configuring Monitoring Groups and Jobs
You can setup so called Monitoring Groups which will be made up of a number of Monitoring Jobs. Each monitoring job executes one of the prepared test scripts.
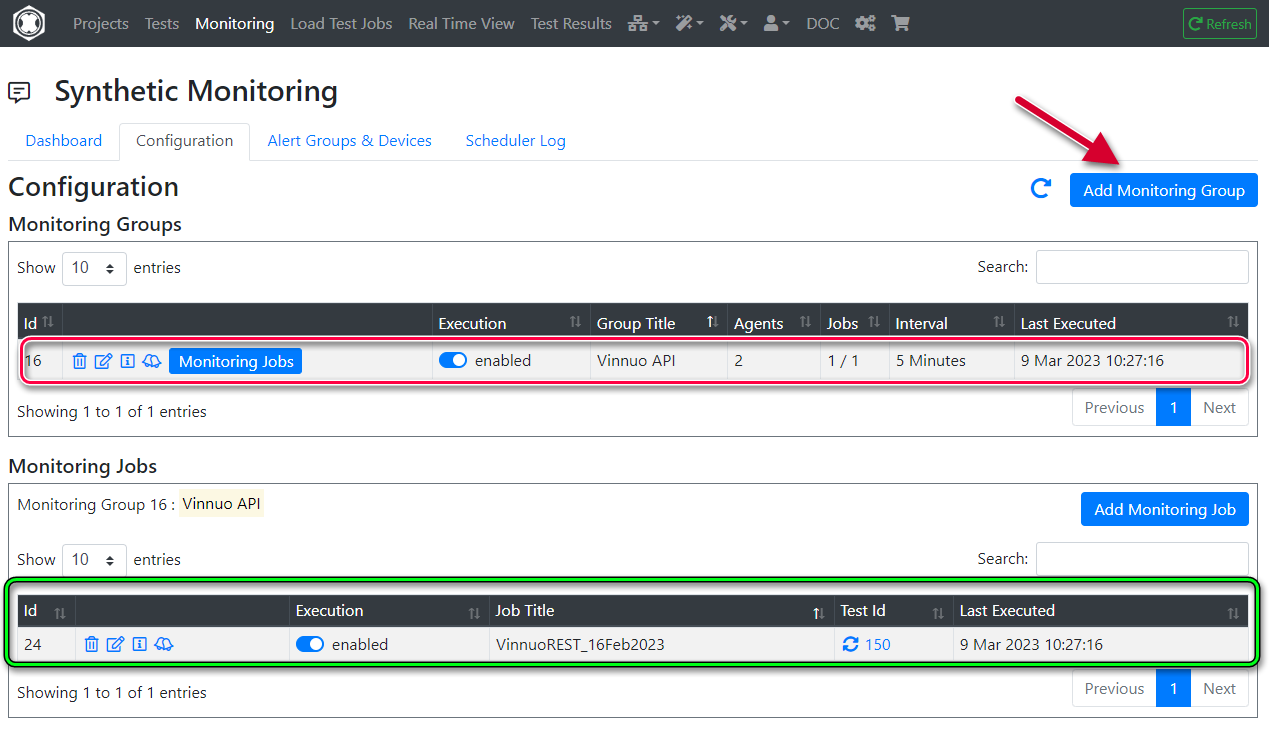
In this screenshot you’ll see one Monitoring Group called “Vinnuo APIs” (in the red box) which executes one test script, highlighted in the green box.
Scheduling execution interval and location
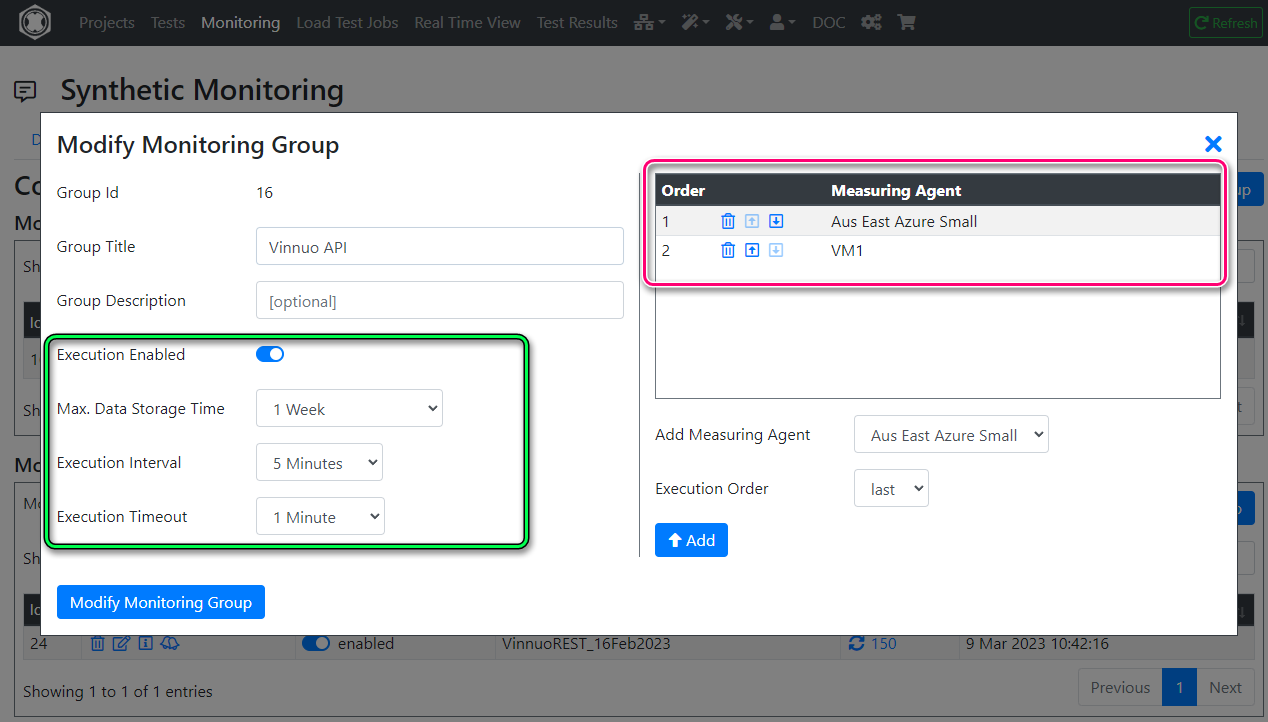
The key properties you can configure on a Monitoring Group are:
- Execution interval: Down to 1 minute, depending on licensing level.
- Execution timeout: How long to wait for the job to complete, before considering it failed.
- Max. Data Storage: How long to retain job execution results. Up to approx. 1 year, depending on licensing level.
- Measuring Agents: The location (agents) to executed the monitoring jobs from. We recommend executing the job from at least 2 agents.
Last, you can enable/disable execution for the group by using the Execution Enabled toggle switch.
Configuring Monitoring Job
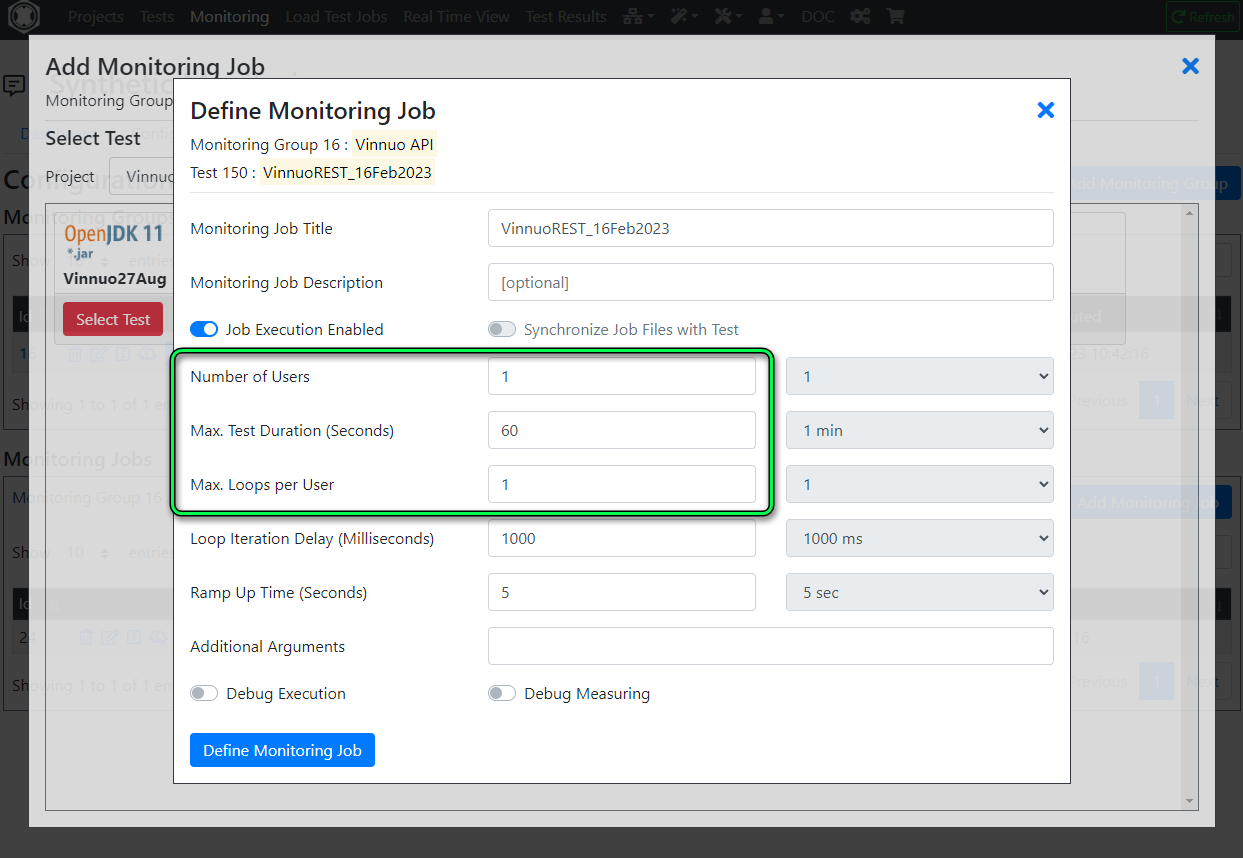
Next, you’ll add at least one Monitoring Job to the Monitoring test. Simply select from one of your projects a Test that was previously prepared.
In this example, I’ve picked one of the test that generates the relevant REST API call(s).

Next you’ll need to configured these key parameters relating to the execution of the test script. If you’re familiar with the load testing features of our product, these parameters will be familiar:
- Number of Users: The number of Virtual Users to simulate. Given this is a monitoring job, this would typically be a low number.
- Max test Duration: This will limit the duration of the job. Again, given this is a monitoring job the Max duration should be kept short.
- Max Loops per User: The maximum number of iterations of the test script executed by each Virtual User. One iteration should typically be sufficient for a monitoring job.
Alerting Groups and Devices
A synthetic monitoring solution wouldn’t be complete with an alerting functionality.
You can configure Alerting Groups to which you can assign a number of different device types to be alerted. Supported device types are:
- Email: An email address to deliver the alert to.
- SMS: SMS alerting. This is subject to additional costs (SMS delivery costs).
- Webhook: You can configure a WebHook, for example integrating with an existing alerting system.
In this example, I’ve created an alerting group called “SafeArea IT”…
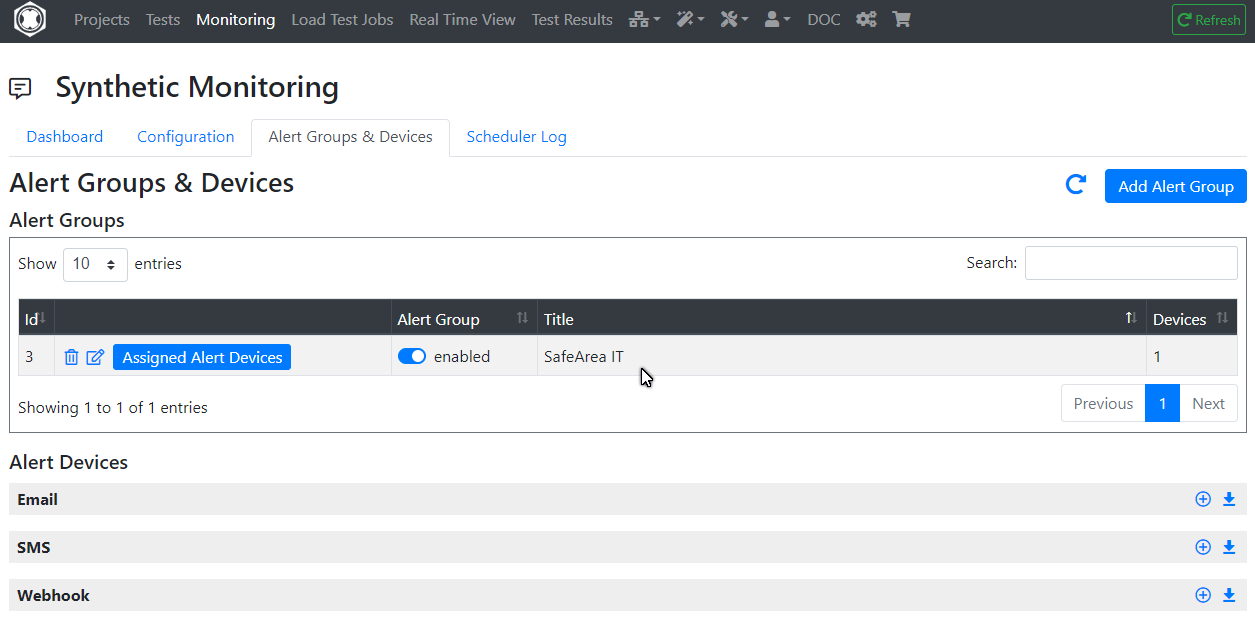
… to which I’ve assigned one email alerting device. Needless to say, you can assign the same alerting group to multiple

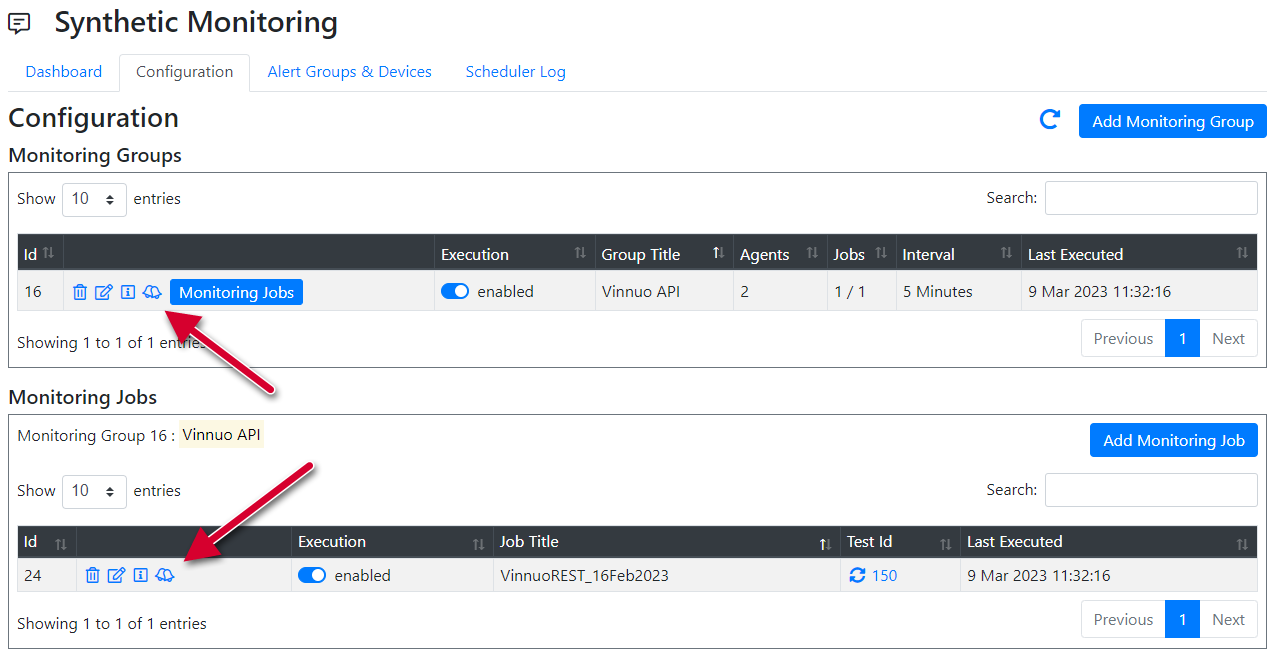
Now that the Alerting Groups are configured, you can configure alerting at the Monitoring Group or Monitoring Job level, whichever best suits your use case. Simply click on the alert icon and assign the Alerting Groups accordingly:
Monitoring Dashboard
Once you’re done with the configuration, you’ll be able to monitor the health of your applications from the Real Time Dashboard. Please note that his dashboard is in evolution, and we’re adding new features on a regular basis.
For now, you’ll be able to:
- See the overall status of all your synthetic monitoring jobs.
- Look at the results of the last test execution for each job by clicking on the graph symbol pointed at by the red arrow.
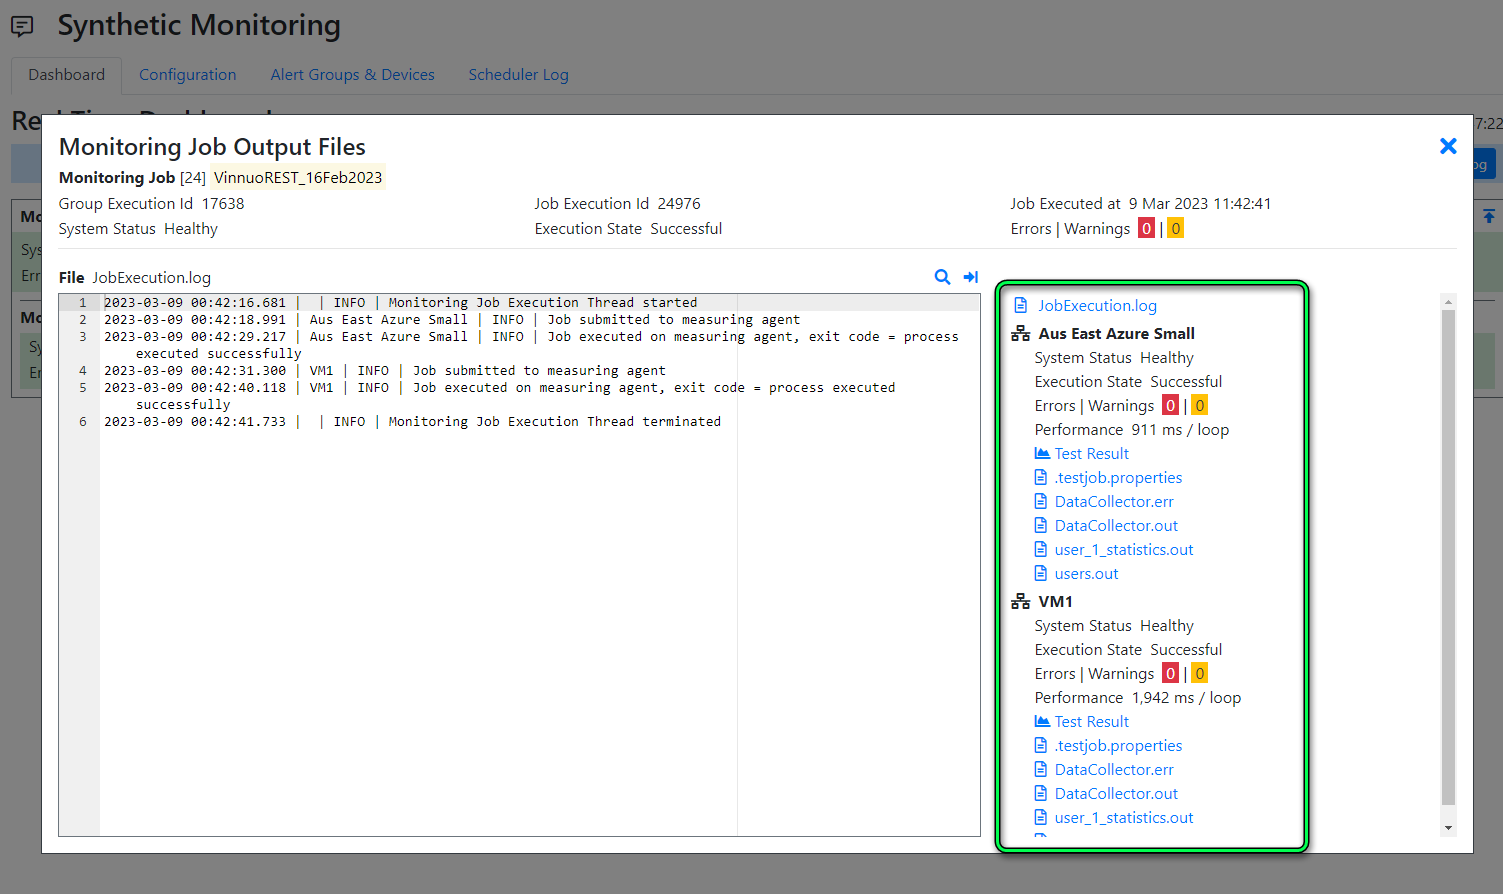
- Look at the logs of the last execution by clicking at the symbol pointed at by the green arrow.
- Look at the overall scheduling log by clicking at the symbol pointed at by the blue arrow.

This screenshot shows the logs collected for the last job execution (green arrow). Note the additional logfiles (higlighted in the green box) that you can look at.
Interested?
Regardless of whether your looking for a Synthetic Monitoring or Perfomance Testing solution, we can satisfy both needs.
Sign up for a free account on our portal portal.realload.com and click at “Sign up” (no Credit Card required). Then reach out to us at support@realload.com so that we can get you started with your first project.
Happy monitoring and load testing!