This is the multi-page printable view of this section.
Click here to print.
Return to the regular view of this page.
User Guide
How to use RealLoad
Thank you for using the RealLoad product.
This User Guide gives you an overview of how to use RealLoad and also contains numerous links to relevant details.
The order of the chapters in this guide corresponds to the order of the menus in the Main Navigation Bar.


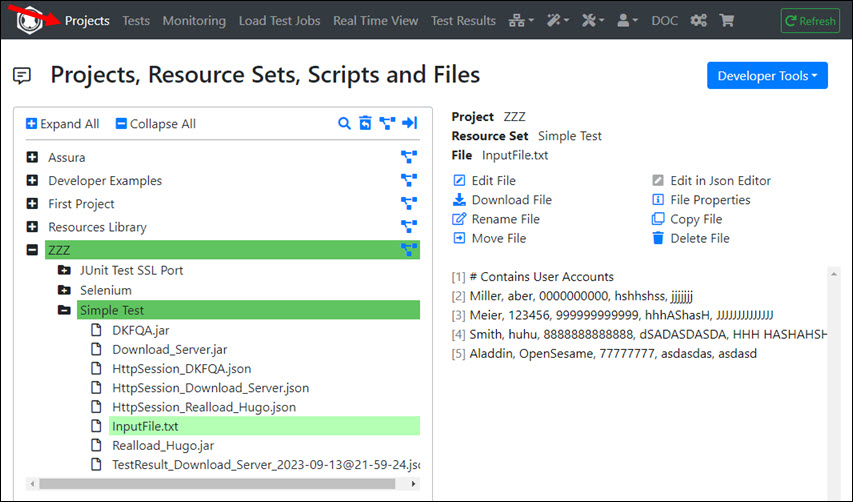
After you have signed in to the RealLoad Portal, you will see a Main Navigation Bar whose first menu on the left is Projects.
This is a file browser that displays all of your files. The view is divided into Projects and Resource Sets which contain all the files for executing your tests and the test results of the executed load tests.
You can also store additional files in a Resource Set which contain e.g. instructions on how a test should be performed.
Among other things, you can:
- Create, clone and delete projects.
- Create, clone and delete resource sets (subdirectories of projects).
- Searching for files by file name and by content.
- Upload and download files, create new files, display the content of files, edit and delete files.
There is also a recycle bin from which you can restore deleted projects, resource sets and files.
In the Developer Tools dropdown menu, there is a wizard that supports converting a Selenium IDE Test to a RealLoad Test, and an example of developing a JUnit Test from scratch.
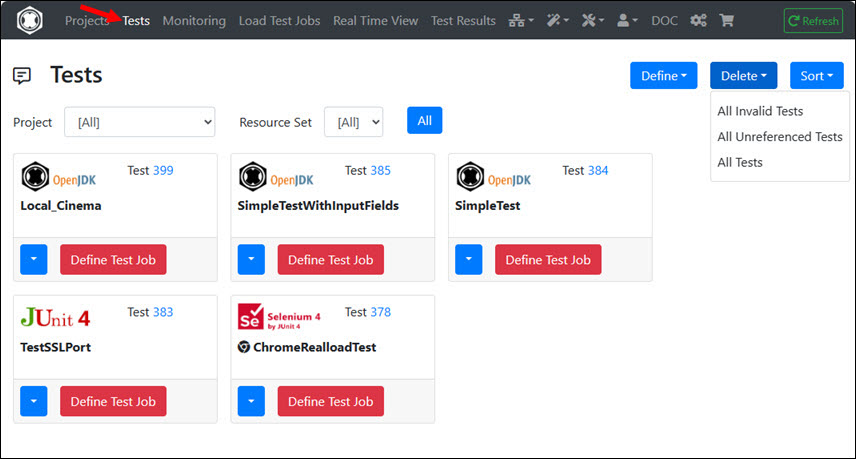
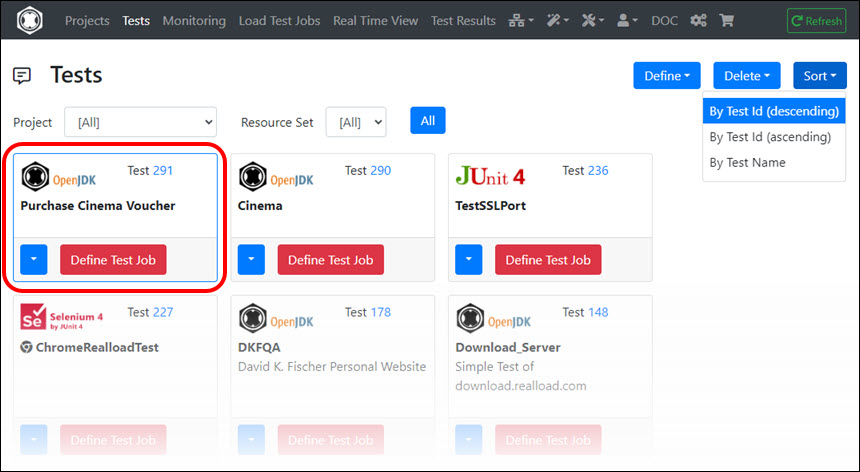
The Test Menu shows all tests that you have defined.
You can also filter the view according to Projects and Resource Sets, and sort the tests in different ways.
Tests can defined:
- By the HTTP Test Wizard (Web Surfing Sessions and HTTP API Tests)
- From exported Selenium IDE Tests (Execution of real Web Browser Tests)
- From imported or self-developed JUnit Tests (Testing any type of Network Protocol such as DNS, SMTP or UDP)
…and can be executed:
- As Load Test Job
- As Regression Test (Part of a Test Suite)
- As Synthetic Monitoring Job
Tip
After you have defined a test, you should always
first run it as a Load Test Job as described below (possibly with only one or a few virtual users) - to verify the correct functionality of the test.
You can then also configure the test as
Regression Test or as
Synthetic Monitoring Job.

Note that a test is something like a bracket that only contains references to the files that are required for the test execution. There a no files stored inside the test itself.
Each test has a base location from which it was defined (Project + Resource Set) and to where also the load test results are saved.
A test itself can reference its resource files in two ways:
- Resource Files that reside in the base location of the test (the test core files).
- Referenced Files that are located in other Projects / Resource Sets. These are typically libraries, plug-ins and input files which are used/shared by several, different tests.
Defining a Load Test Job
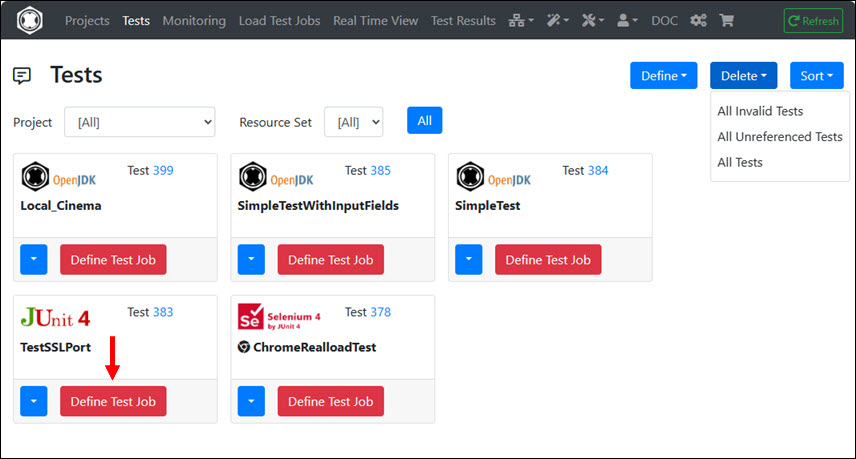
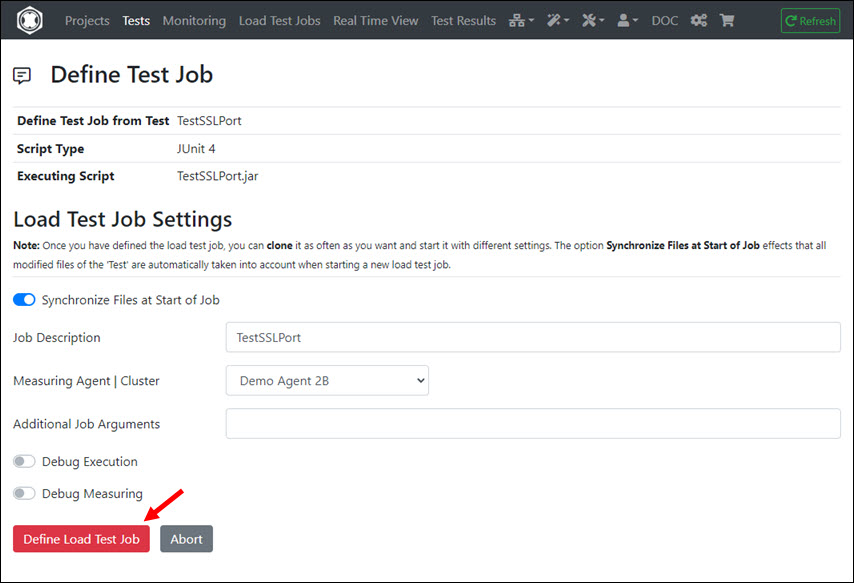
After you have clicked on a test on “Define Test Job”, the intermediate “Define Test Job” menu is displayed.


In contrast to a “test”, all referenced files of the test are copied into the “load test job”.
For this reason there is also the option “Synchronize Files at Start of Job” which you should always have switched on.
At “Additional Job Arguments” you can enter test-specific command line arguments that are transferred directly to the test program or test script.
However, you usually do not need to enter anything.
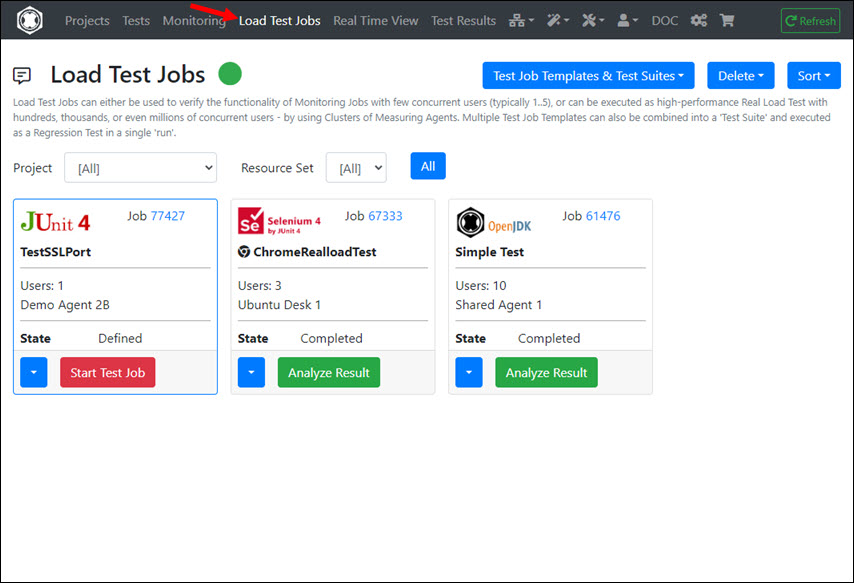
After you have clicked on “Define Load Test Job” the test job is created and the view changes from the “Tests” menu to the Load Test Jobs menu.
This menu is documented at Synthetic Monitoring.
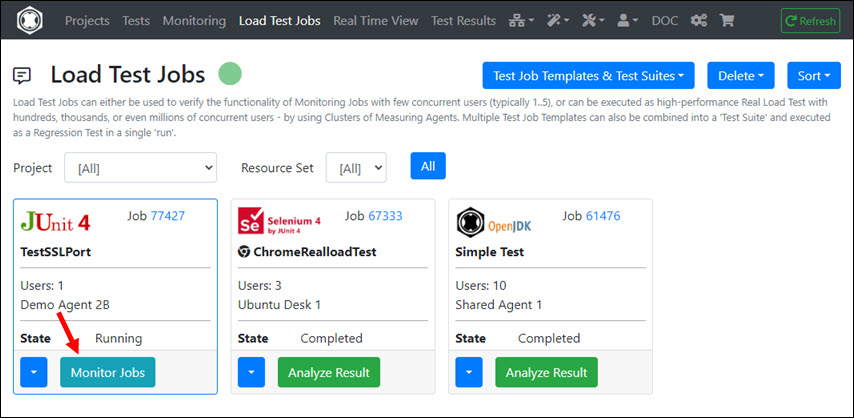
In this menu all load test jobs are displayed with their states.
The green point at the top right next to the title indicates that all measurement agents and cluster controllers which are set to ‘active’ can also be reached.
The color of the point changes to yellow or red if one or more ‘active’ measuring agents and cluster controllers cannot be reached / are not available.

A load test job can have one of the following state:
- invalid: The job is damaged and can only be deleted.
- defined: The job is defined locally in the portal server, but has not yet been transmitted to a measuring agent or cluster controller. Jobs that are in this state can still be modified.
- submitted: The job was transmitted to a measuring agent or cluster controller, but is not yet ready to be started.
- ready to run: The job on the measuring agent or cluster controller is ready to start.
- start failed: The start of the job has failed.
- running: The job is currently running and can be monitored at real time.
- completed: A job that was previously running is now completed (done).
As soon as a job is in the “defined” state, it has a “local job Id”. If the job is then submitted to a measuring agent or cluster controller, the job has additionally a “remote job Id”.
Tip
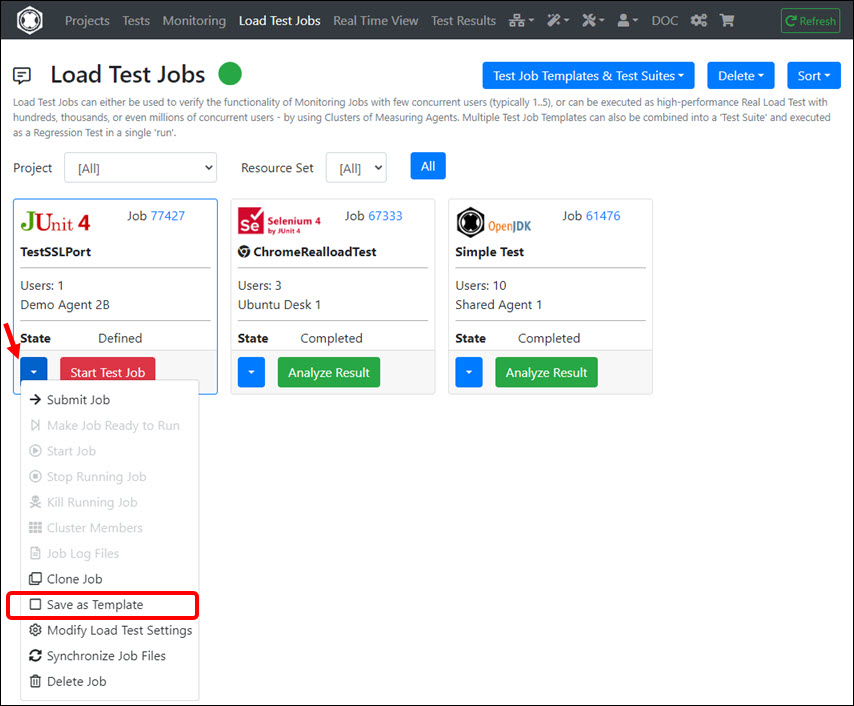
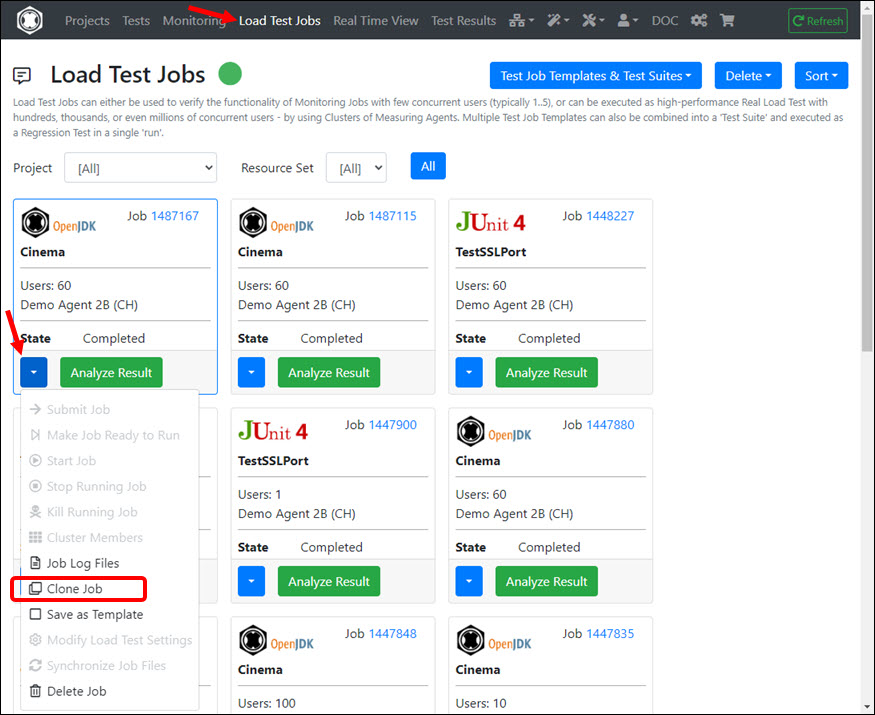
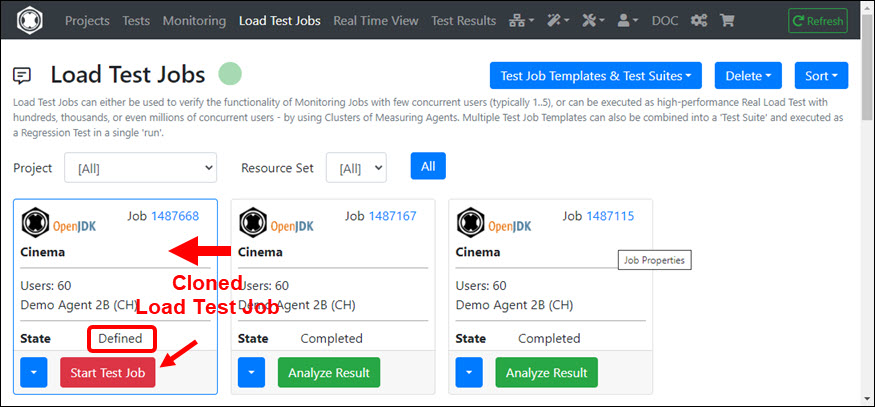
Jobs that are in any state (except invalid) can be cloned. Cloning a job means that the job is copied and that the copied job gets a new “local job Id” and the state “defined”.
Cloned jobs can be modified and then started once again.
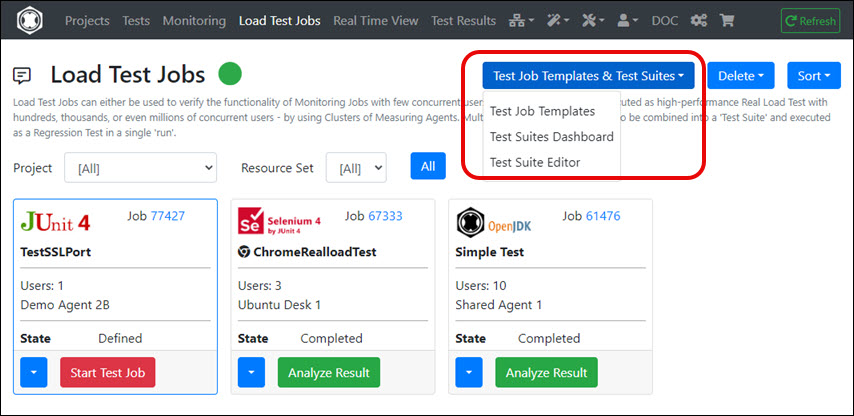
From this menu you can also create Test Job Templates and edit Test Suites - which can be executed as Regression Tests.


Starting a Load Test Job
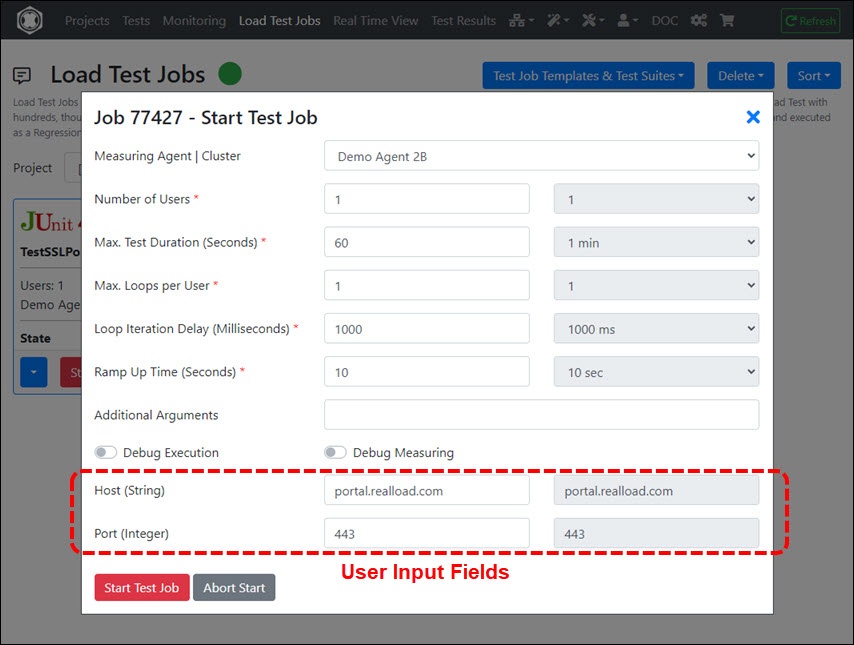
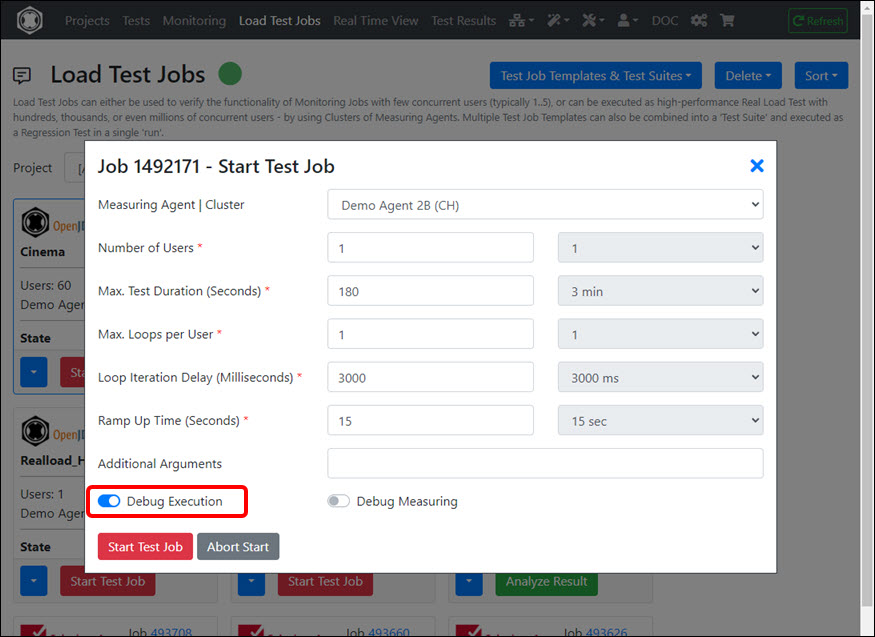
After you have clicked on “Start Test Job” in a load test job you can select/modify the Measuring Agent or Cluster of Measuring Agents on which the job will be executed, and you can configure the job settings.

Input Fields:
- Measuring Agent | Cluster: The Measuring Agent or Cluster of Measuring Agents on which the load test is executed.
- Number of Users: The number of simulated users that are started.
- Max. Test Duration: The maximum test duration.
- Max. Loops per User: The maximum number of sessions executed per user (the number of iterations of the test per user). Each time a new session of a user is started, the user’s session context is reset.
- Loop Iteration Delay: The delay time after a session of a user has ended until the next session of the user is started.
- Ramp Up Time: The length of time at the beginning of the test until all simulated users are started. Example: with 20 simulated users and a time of 10 seconds, a new user is started each 0.5 seconds.
- Additional Arguments: Additional values which are transferred on the command line when the test script is started.
These arguments are test specific. For tests that were created with the “HTTP Test Wizard” you can specify for example the following values:
“-tcpTimeout 8000 -sslTimeout 5000 -httpTimeout 60000” (TCP connect timeout / SSL handshake timeout / HTTP processing timeout) which are considered by the executed URL calls and override the default values.
- Debug Execution: This option effects that detailed information are written to the log file of the test. For example variable values which have been extracted from input files or from HTTP responses as well as variable values which are assigned at runtime. Only activate this option if you have problems with the execution of the test.
- Debug Measuring: Effects that the Data Collector of the Measuring Agent writes the JSON objects of the All Purpose Interface to its log file. This option can be enabled to debug self-developed tests that have been written from scratch.
- (User Input Fields): If the test contains User Input Fields you can enter their values here.
Normally you do not have to enter any “Additional Arguments” and leave “Debug Execution” and “Debug Measuring” switched off.
Note
The load test ends (itself) when either the “Max. Test Duration” is reached or the “Max. Loops per User” is reached - if one of these two values is reached.
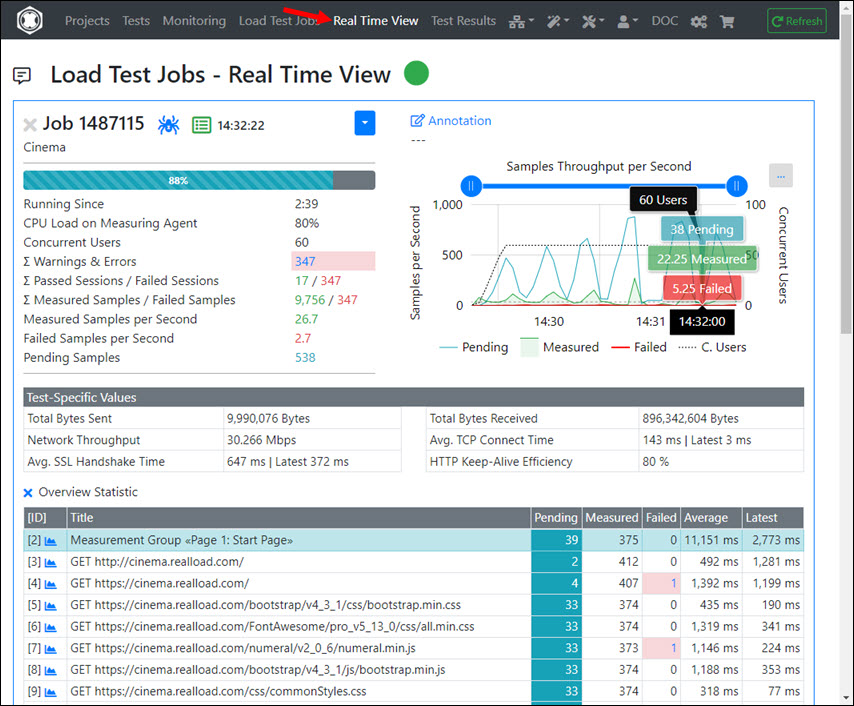
After clicking Start Test Job, the job is started on the Measuring Agent or Custer of Measuring Agents and is then in the state “Running”. Then click on “Monitor Jobs” and the view changes from the “Load Test Jobs” menu to the Real Time View menu.

The real time view shows all currently running load test jobs including their measured values and errors.

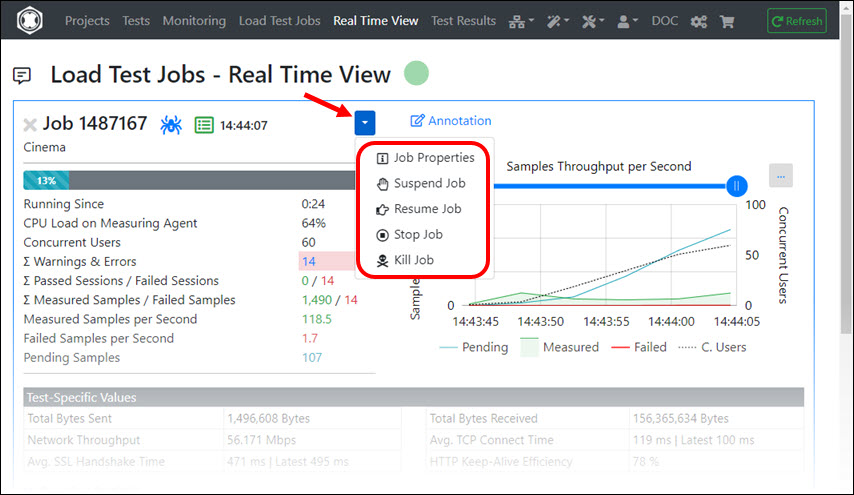
You can also suspend a running job for a while and resume it later. However this has no effect on the “Max. Test Duration”.

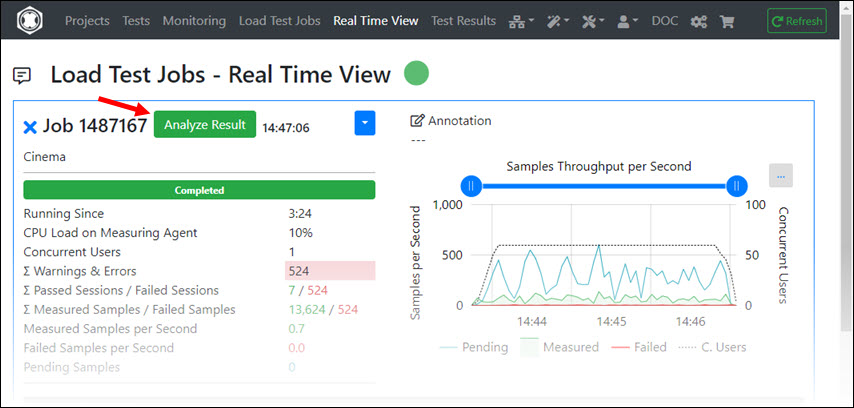
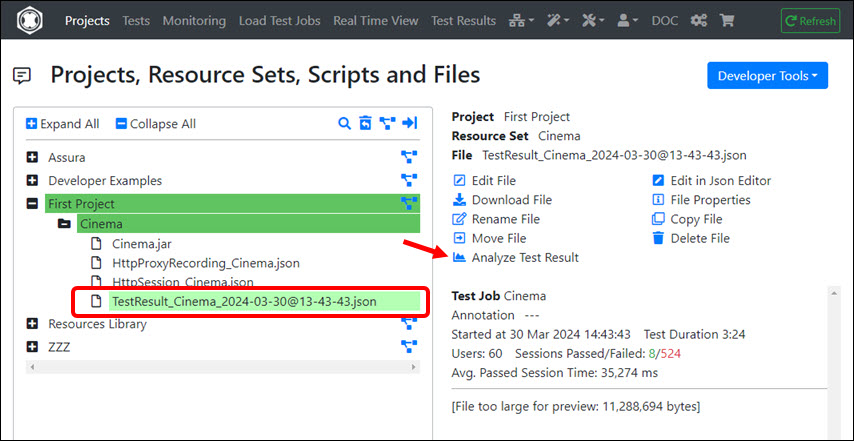
After the job is completed you can click on “Analyze Result”. The view changes then to the Test Results menu.

Tip
If you exit the “Real Time View” menu before the job has ended and return to the “Real Time View” menu after the job has ended, the job will no longer be visible there.
Solution: Navigate to the
Load Test Jobs menu and click on “Analyze Result” in the corresponding job.
Note
If you click on “Analyze Result”, the test result is also copied into the Project / Resource Set from which the test was defined.
From there you can reload the test result into the Test Results menu at any time.

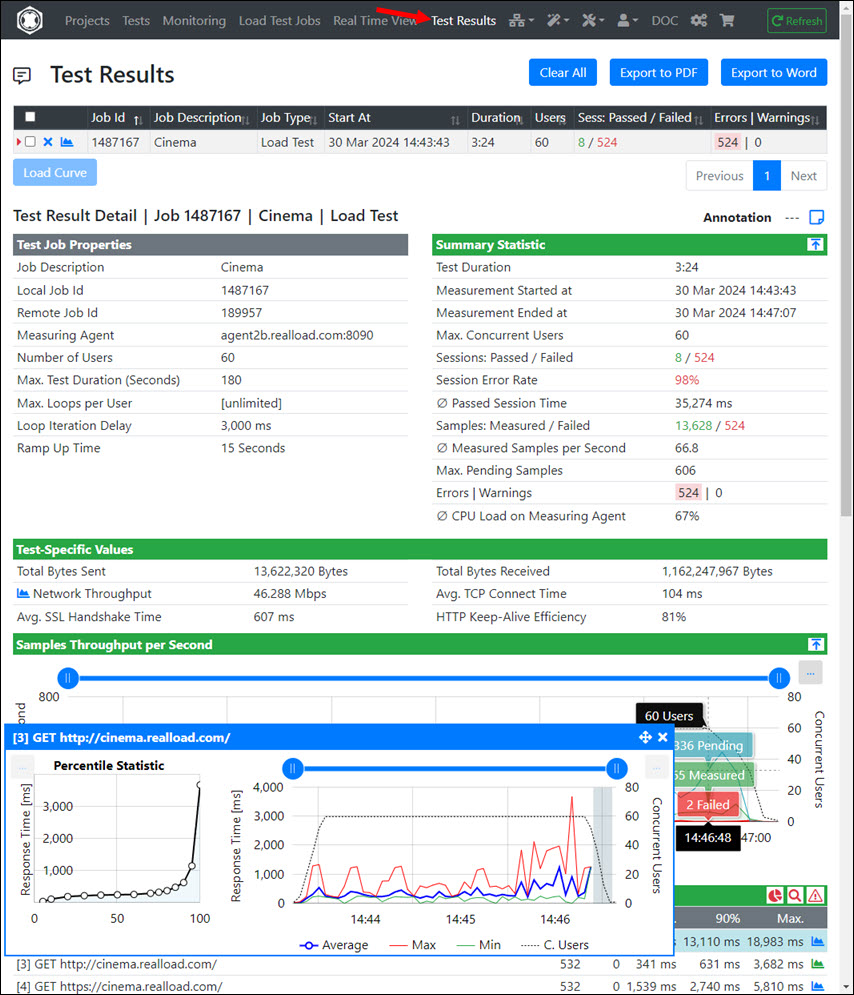
The “Test Results” menu is a workspace into which you can load multiple test results from any type of test. You can also switch back and forth between the test results.
All measured values and all measured errors are displayed. In addition, Percentile Statistics and Diagrams of Error Types are also displayed in this menu.
This menu enables you also to combine several test results into a so-called Load Curve - to determine the maximum number of users that a system such a Web server can handle (see next chapter).

The Summary Statistic of a test result contains some interesting values:
- ∅ Measured Samples per Second: These are the number of successful measured values per second, counted over the whole test (in other products also so-called as “hits per second”).
- Max. Concurrent Users: These are the maximum number of concurrent user that have been really reached during the test (which may differ from the “Number of Users” defined when starting the test).
- Max. Pending Samples: This is the maximum amount of requests to the server, for which no immediately response has been received, measured over the whole test (the maximum traffic jam of the requests).
- ∅ CPU Load on Measuring Agent: This is the average CPU load in percent on the measuring agent (load generator) or on the members of a measuring agent cluster - which was captured during the execution of the test. If this value is greater than 95% the test is invalid because the measuring agent was overloaded.
Since several thousand to several million response times can be measured in a very short time during a test, the successfully measured response times are summarized in the response time diagrams at 4-second intervals.
For this reason, a minimum value, a average value and a maximum value is displayed for each 4-second interval in such diagrams.
However, this summarization is not performed for Percentile Statistics and for Measured Errors. Every single measured value is taken into account here.
Determining System Capacity - Load Curve
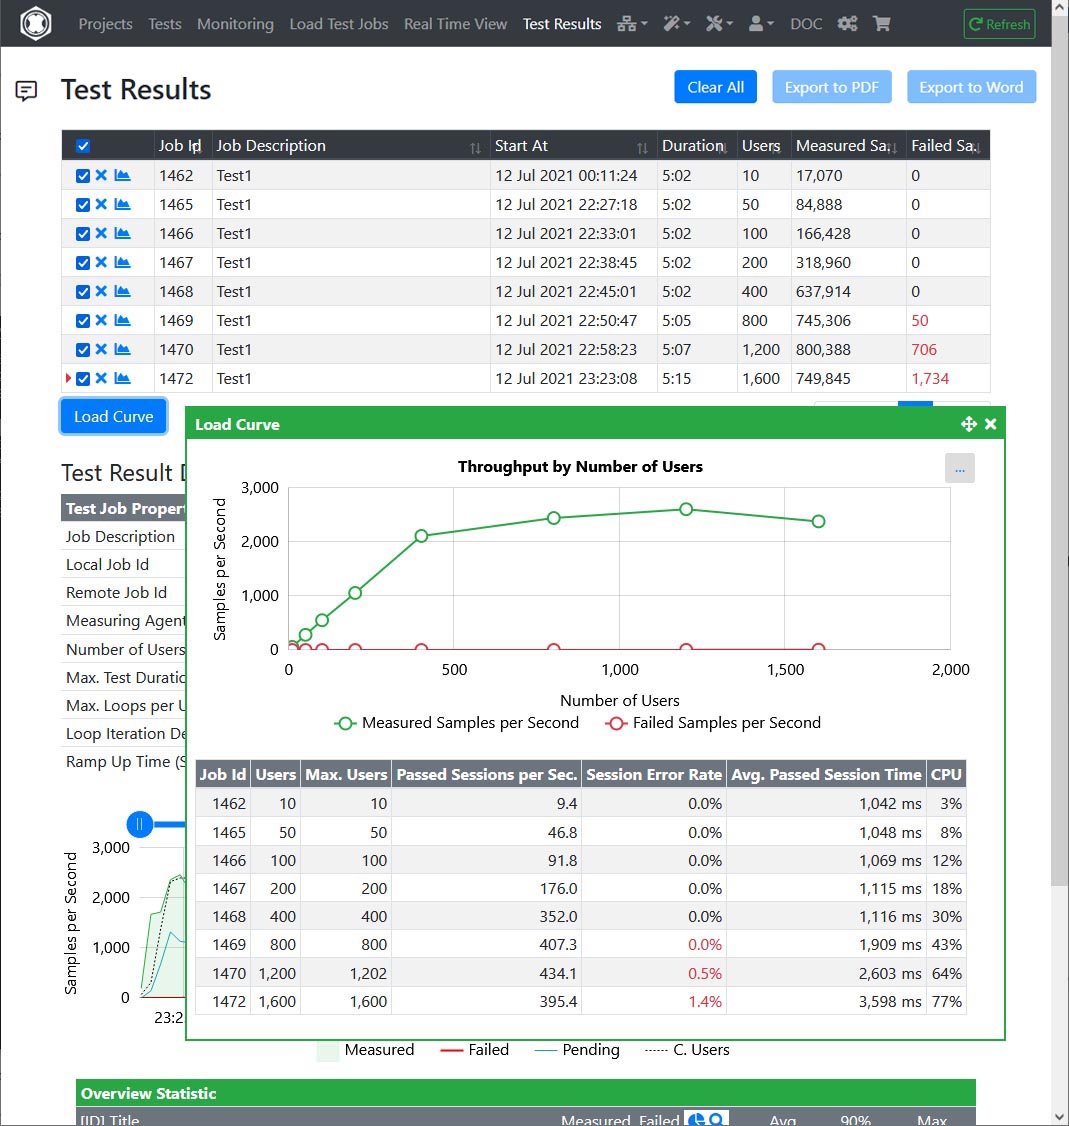
The maximum capacity of a system, such as the maximum number of users that a web server can handle, can be determined by a so-called Load Curve.
To obtain such a Load Curve, you must repeat the same load test several times, by increasing the number of users with each test. For example a test series with 10, 50, 100, 200, 400, 800, 1200 and 1600 users.
The easiest way to repeat a test is to Clone a Load Test Job. You can then enter a higher number of users when starting the cloned load test job.


A measured Load Curve looks like this, for example:

As you can see, the throughput of the server increases linearly up to 400 users - with the response times remaining more or less the same (Avg. Passed Session Time).
Then, with 800, 1200 and 1600 users, only individual errors are measured at first, then also many errors, with the response times now increasing sharply.
This means that the server can serve up to 400 users without any problems.
But could you operate the server with 800 users if you accept longer response times? With 800 users, 745,306 URL calls were successfully measured, with only 50 errors occurring.
To find it out, let’s compare the detailed response times of “Page 1” of 400 users with 800 users.
Response Times of “Page 1” at 400 Users:

Response Times of “Page 1” at 800 Users:

The 95% percentile value at 400 users is 224 milliseconds and increases to 1952 milliseconds at 800 users.
Now you could say that it just takes longer.
However, if you look at the red curve of the outliers, these are only one time a little bit more than 1 second at 400 users, but often more than 8 seconds at 800 users.
Conclusion: The server cannot be operated with 800 users because it is then overloaded.
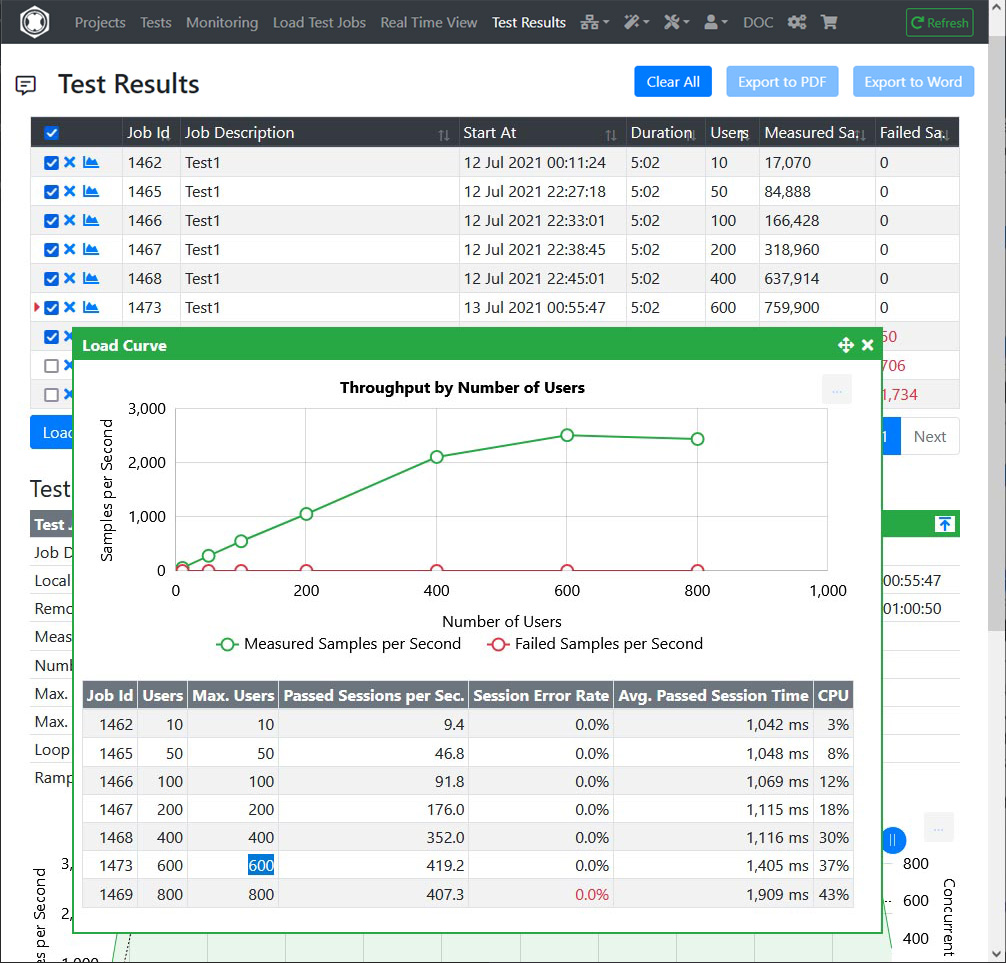
Now let’s do one last test with 600 users. Result:

The throughput of the server at 600 users is a little bit higher than at 400 users and also little bit higher than at 800 users. No errors were measured.
Response Times of “Page 1” at 600 Users:

The 95% percentile value at 600 users is 650 milliseconds, and there are only two outliers with a little bit more than one second.
Final Conclusion: The server can serve up to 600 Users, but no more.
Troubleshooting a Load Test
In rare cases it can happen that a test does not measure anything (neither measurement results nor errors).
In this case you should either wait until the test is finished or stop it directly in the “Real Time View” menu.
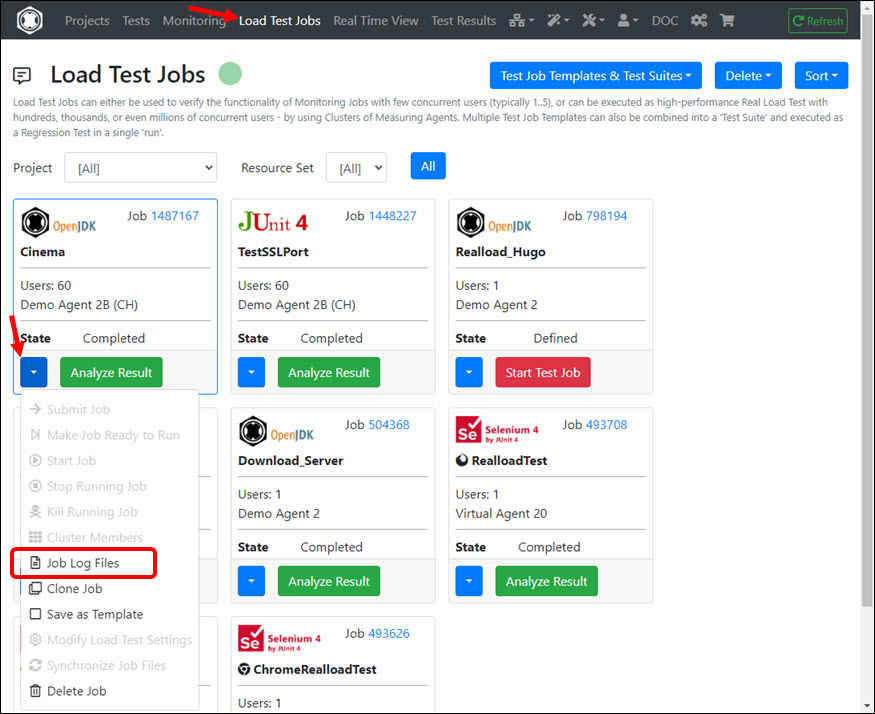
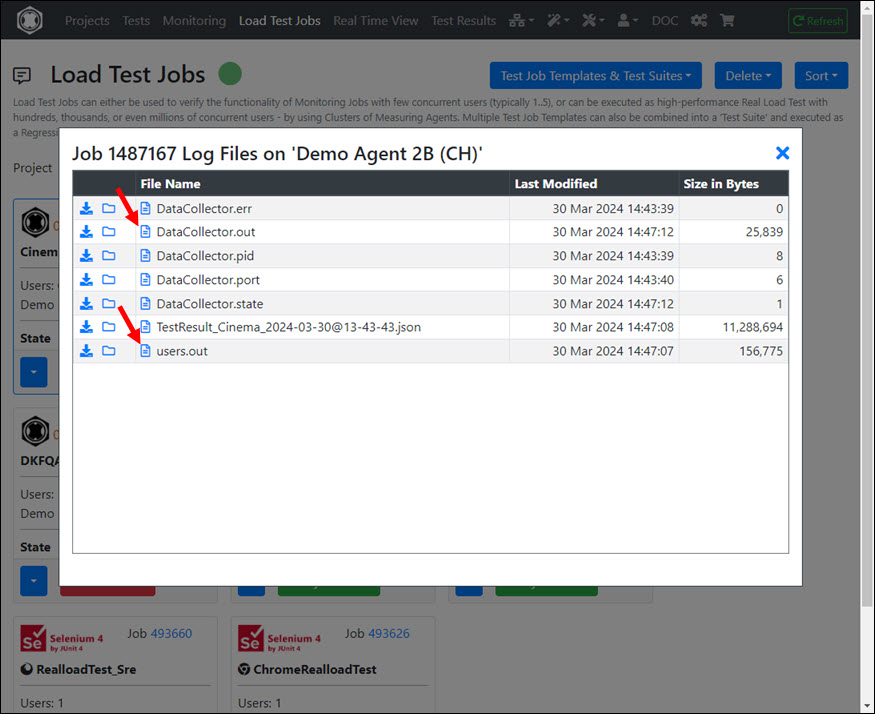
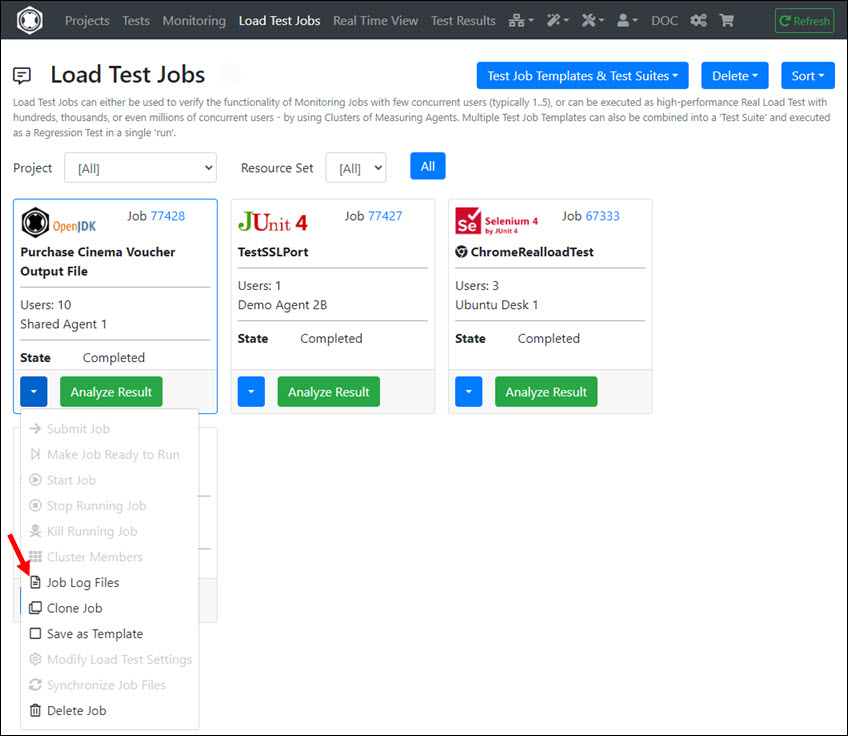
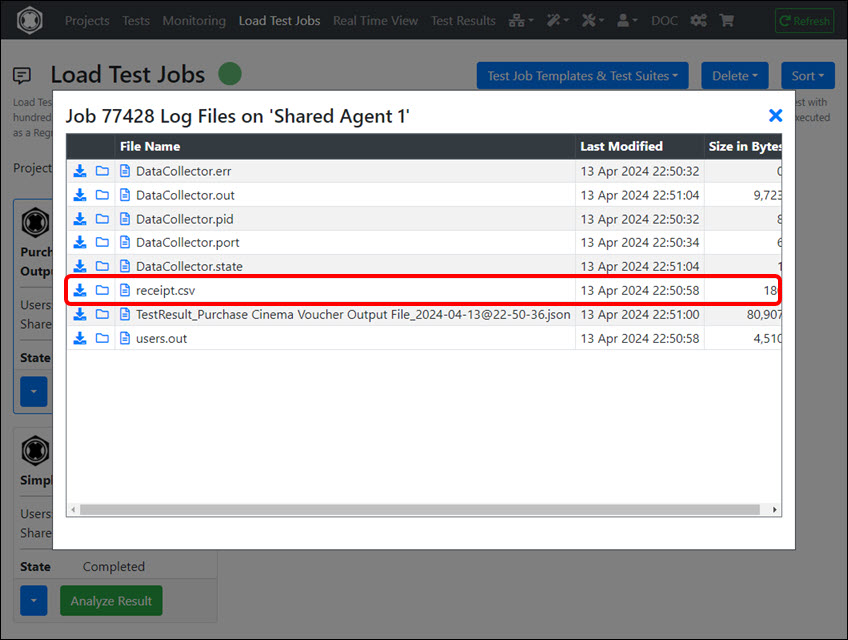
Then you can then acquire the test log files in the “Load Test Jobs” menu and search for errors.


Tip
If your test has problems when extracting and assigning variable values, you should also search the log files for error messages.
To get detailed information you can run the test once again - but this time with the option “Debug Execution” enabled.

Don’t forget to turn off the “Debug Execution” option after the problem has been solved.

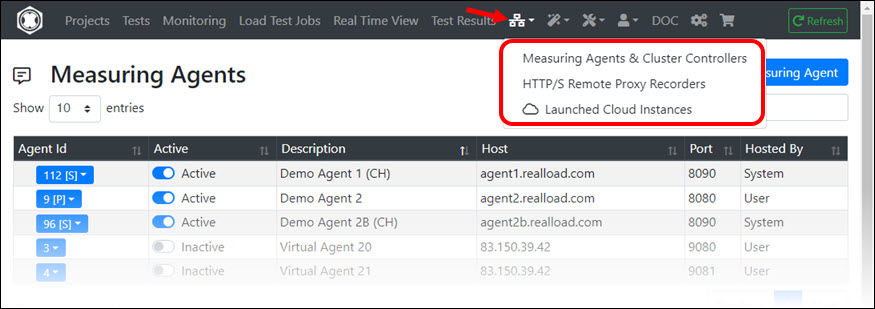
The Network Components menu allows you to manage Measuring Agents, Cluster Controllers and HTTP/S Remote Proxy Recorders. In addition, you can also start additional components that you only need for a short time as AWS Cloud Instances by spending RealLoad Cloud Credits.
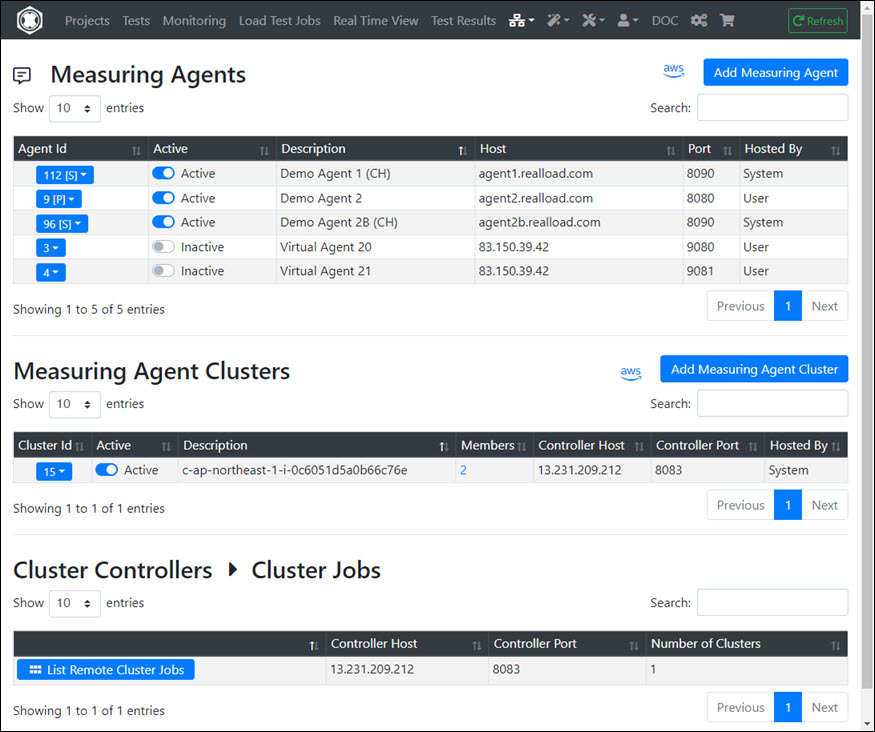
Measuring Agents & Cluster Controllers
On the one hand, depending on your license (Price Plan), you can add and manage Measuring Agents and Cluster Controllers that you operate yourself. On the other hand, you can also launch additional Measuring Agents and Cluster Controllers using RealLoad Cloud Credits.
How to launch and operate Measuring Agents and Cluster Controllers using your own AWS account is documented at AWS Measuring Agents.

HTTP/S Remote Proxy Recorders

HTTP/S Remote Proxy Recorders can be used to record Web Surfing Sessions, which can then be post-processed with the HTTP Test Wizard and converted into a RealLoad Test.
The most important points here are:
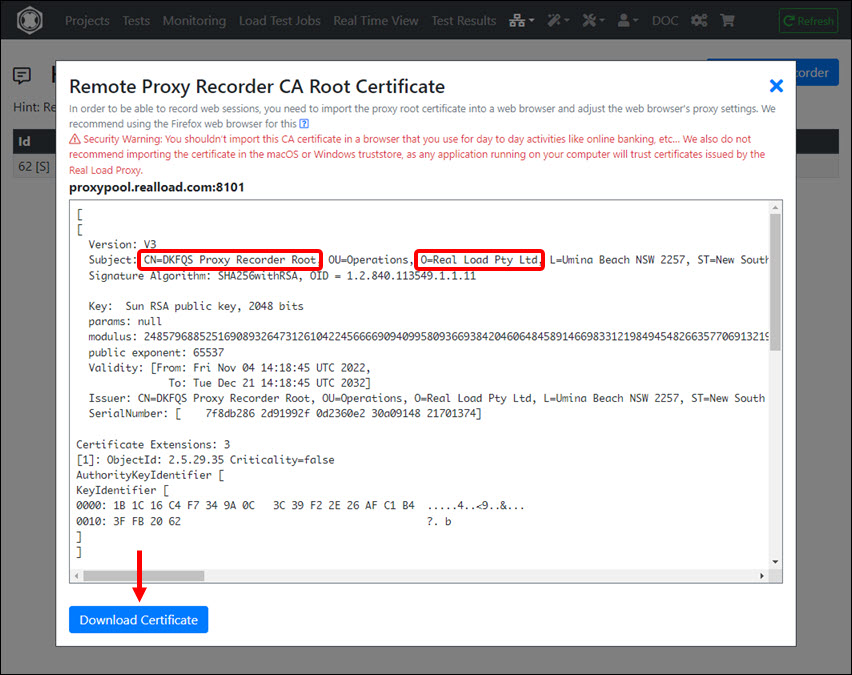
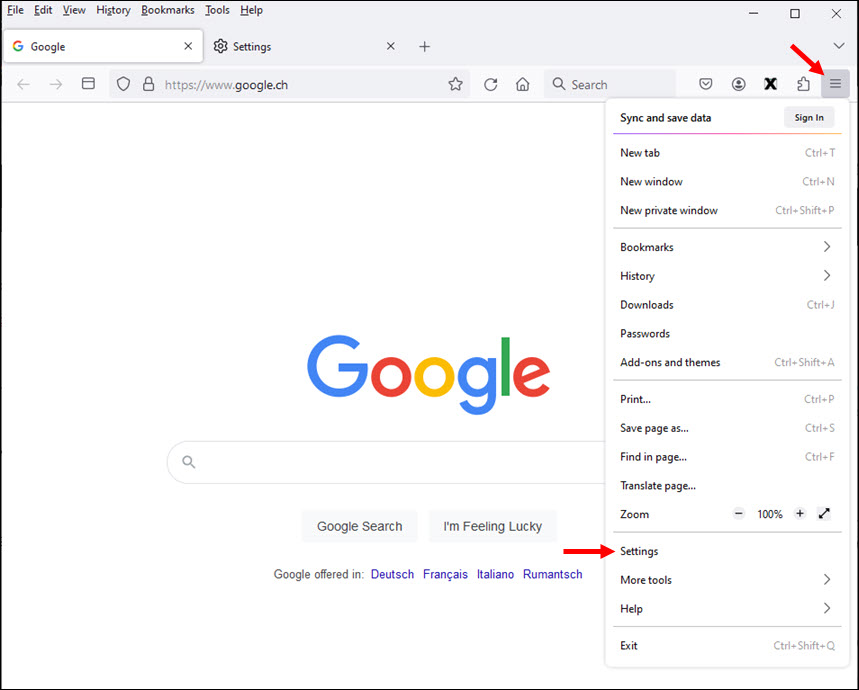
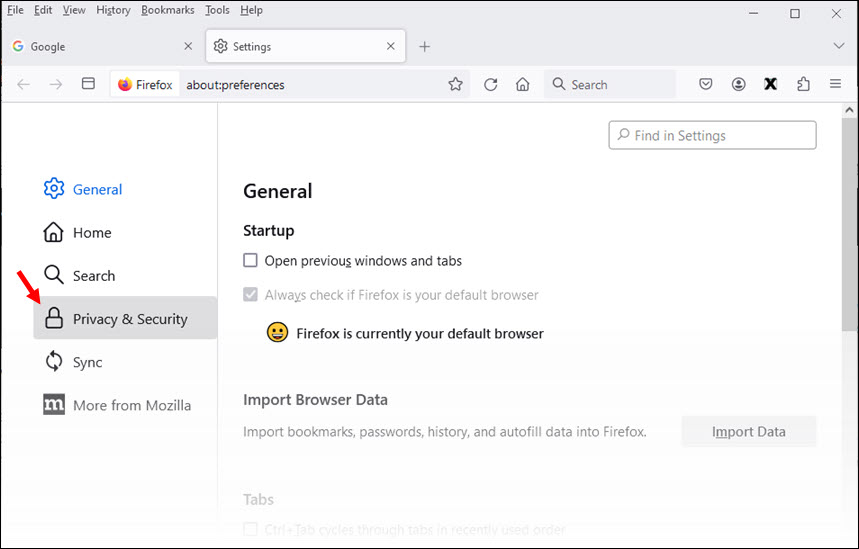
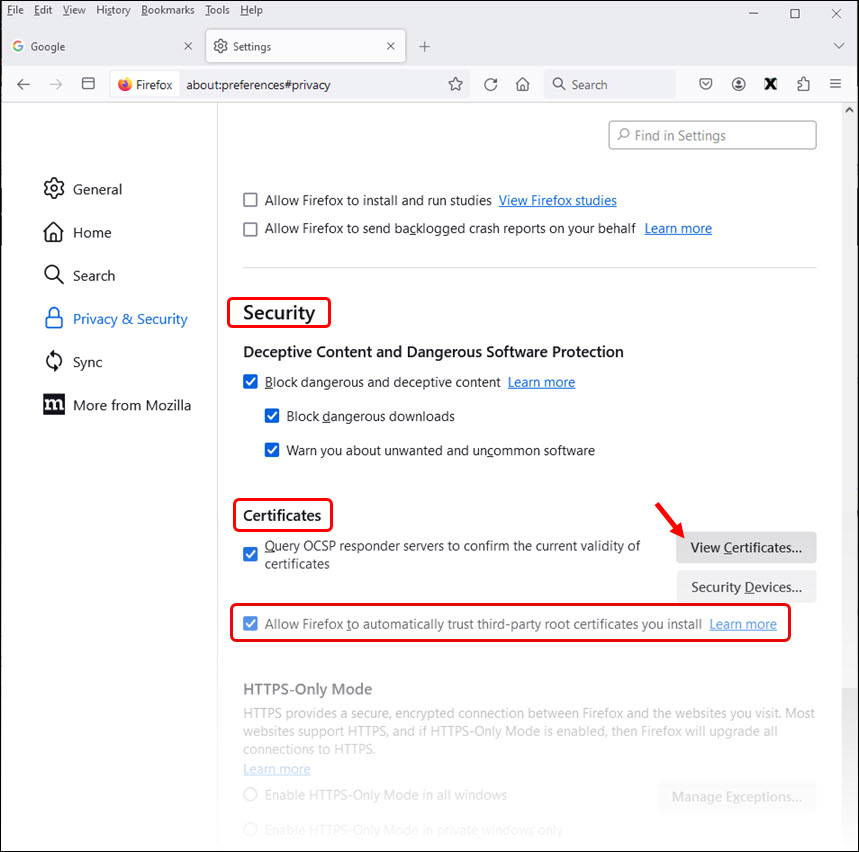
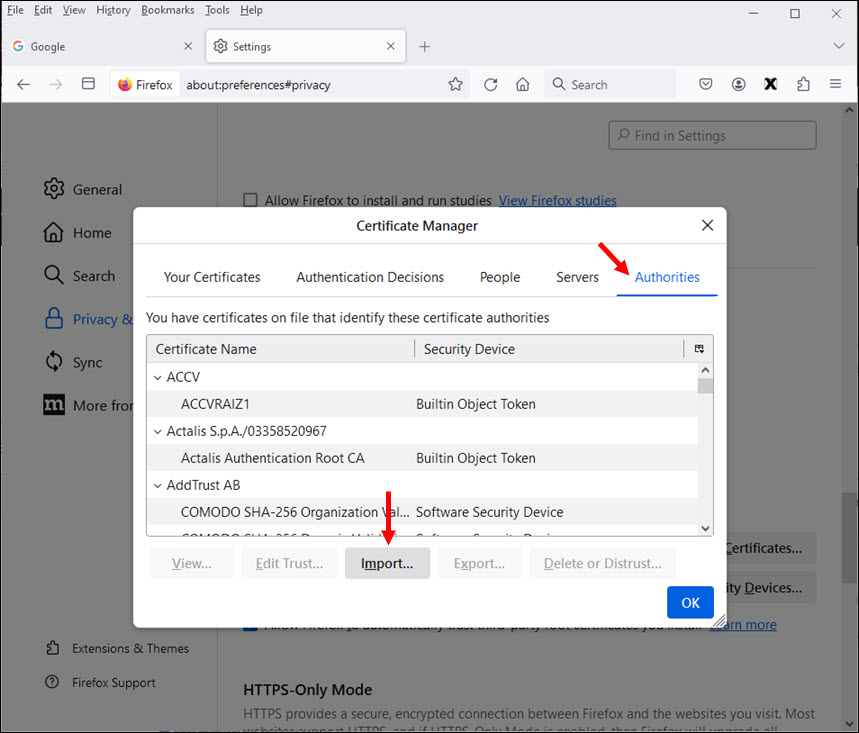
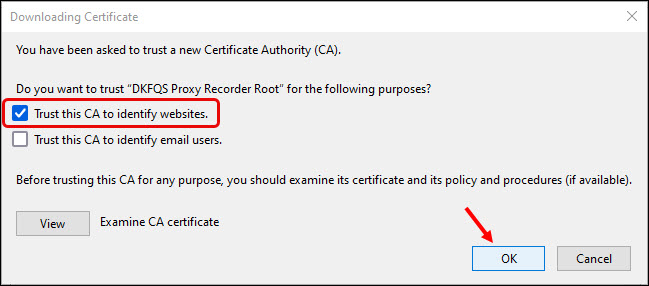
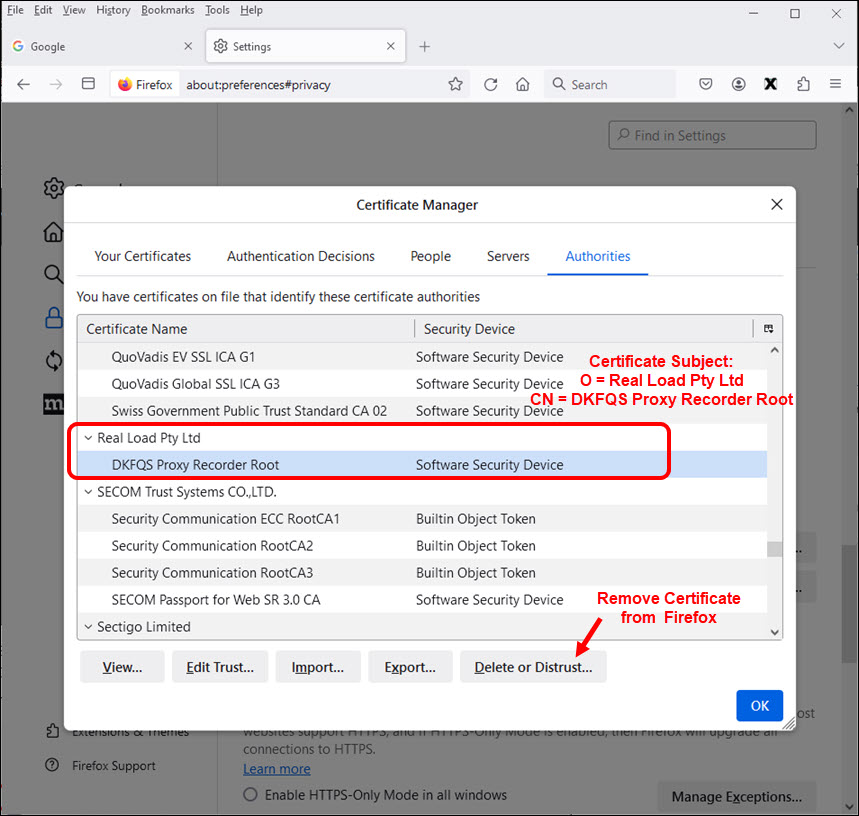
- You must import the CA Root Certificate of the Proxy Recorder into the web browser with which you record the web surfing session (Firefox recommended).
- To control the Proxy Recorder in the RealLoad Portal, you need a second web browser from another manufacturer (Goggle Chrome recommended), or alternatively installation of the RealLoad Browser Extension.
- Optional: When recording, HTTPS/X509 client certificates are also supported to authenticate yourself to the corresponding web server(s) - if required. You can upload the client certificates directly in this menu. The client certificates are then automatically transferred to the proxy recorder and applied during recording.
The complete documentation is available at HTTP/S Remote Proxy Recorder.
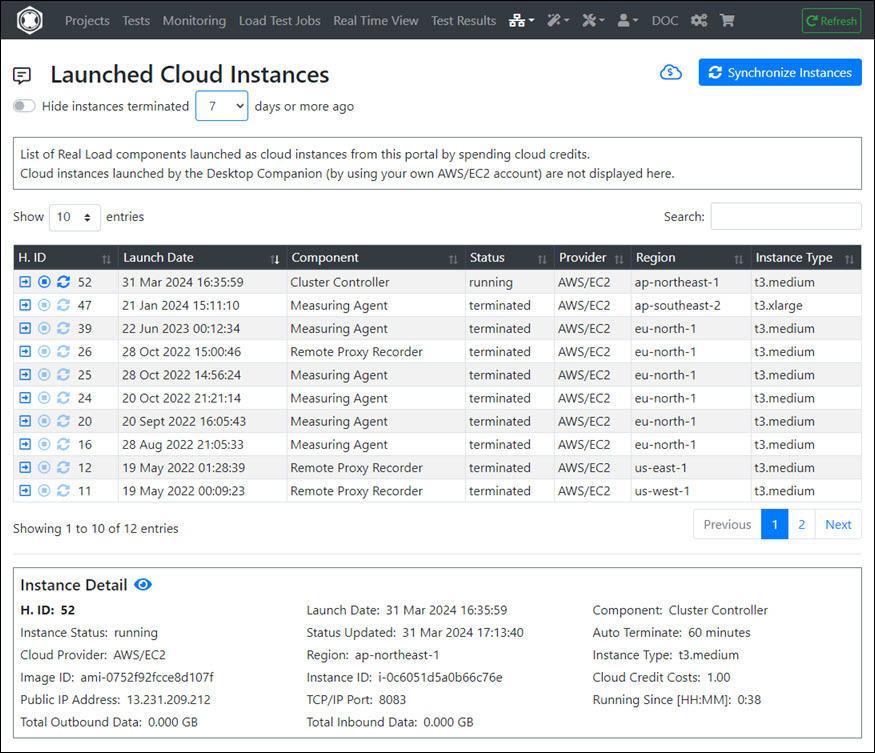
Launched Cloud Instances (by Cloud Credits)
This menu shows (only) all AWS instances that were launched using RealLoad Cloud Credits. Here you can also terminate such instances early - whereby Cloud Credits for complete unused hours are refunded.
Disclaimer
This menu does not display instances launched by your own AWS account, or launched with an AWS account other than Real Load Pty Ltd’s registered AWS account. We disclaim any liability for costs and technical issues associated with instances launched from non Real Load Pty Ltd AWS accounts.

This menu only displays the wizards that can be accessed via direct navigation. In addition, the RealLoad product contains numerous other wizards that are accessible depending on the context.

HTTP Test Wizard
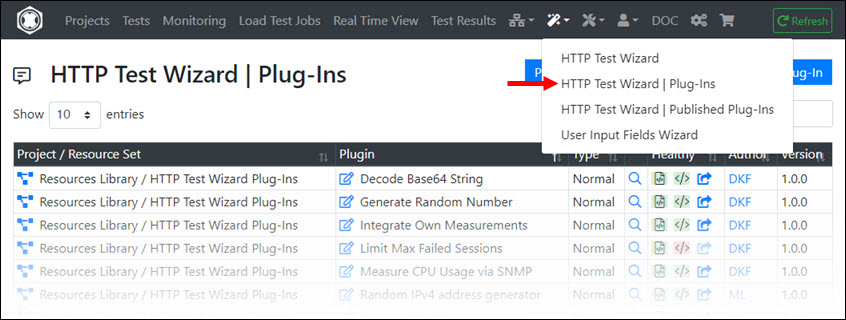
The functionalities of the HTTP Test Wizard (+ Plug-Ins and Published Plug-Ins) is documented at HTTP Test Wizard.
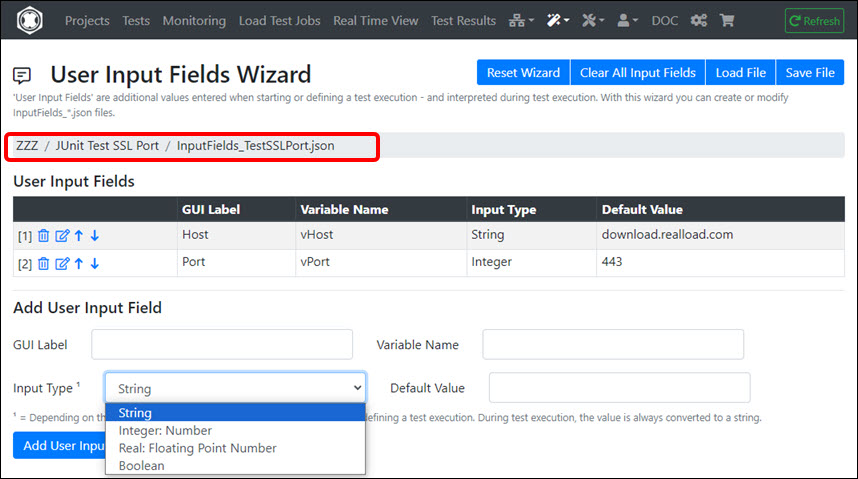
“User Input Fields” are additional values that are entered when starting or defining a test execution and that are available as (global) variables during test execution.
With this wizard you can create or edit JSON files containing definitions of User Input Fields. By convention, the names of such files must always start with ‘InputFields_’ and end with ‘.json’.
A User Input Field contains the following attributes:
- GUI Label : The label of the User Input Field that is displayed in the user interface.
- Variable Name : The name of the global variable at test execution.
- Input Type : The datatype of the input value (String, Integer, Real or Boolean). Please note that the Input Type is only used to validate the input. During test execution, the value of the variable is always converted to a string.
- Default Value : The default value of the variable.

User Input Fields are supported by All Types of RealLoad Tests.

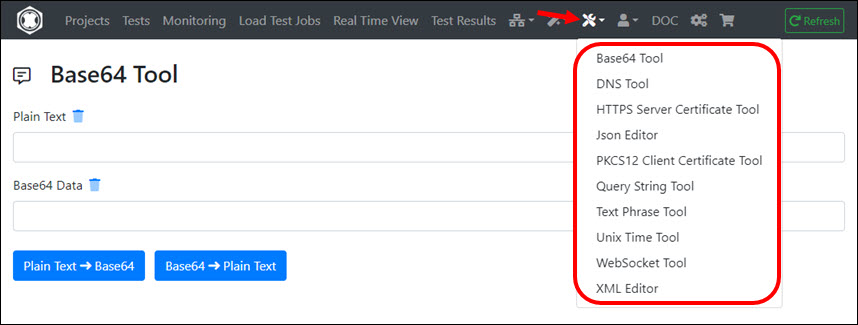
This menu contains tools that are helpful for developing and debugging tests:
- Base64 Tool : Converts plain text to Base64 format or vice versa.
- DNS Tool : This allows you to resolve DNS hostnames through one or more specific DNS servers.
- HTTPS Server Certificate Tool : With this tool you can check the validity of HTTPS server certificates and also create your own (client) Trust Stores.
- JSON Editor : This allows you to create and edit JSON files, as well as display JSON data in a formatted view. Tip: You can also copy raw JSON data into the JSON Editor and then view it as formatted JSON data with a mouse click - without having to save the data to a file.
- PKCS12 Client Certificate Tool : With this tool you can view the contents of an SSL/X509 client certificate which is in PKCS12 format.
- Query String Tool : With this tool you can convert URL Query Strings to the unescaped format or vice versa. See Wikipedia - Query String
- Text Phrase Tool: Determines the most meaningful human-readable text phrases or keywords from any given URL with HTML/JSON/XML response content. This tool’s algorithm is also used by the HTTP Test Wizard to verify the content of HTTP responses.
- Unix Time Tool : Converts a Unix time to a formatted local time - or vice versa.
- WebSocket Tool : This allows you to test a WebSocket connection to a web server. The tool also supports SSL/X509 client certificates in PKCS12 format.
- XML Editor : This allows you to create and edit XML files.

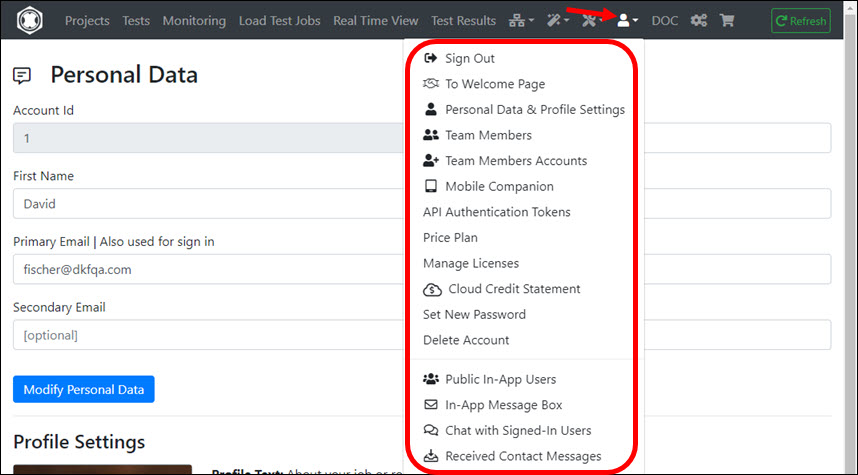
Submenus:
- Sign Out : This will sign out you out without asking. Any tests that may be running are not affected by this and will continue.
- To Welcome Page : Displays the welcome page analogously after sign up.
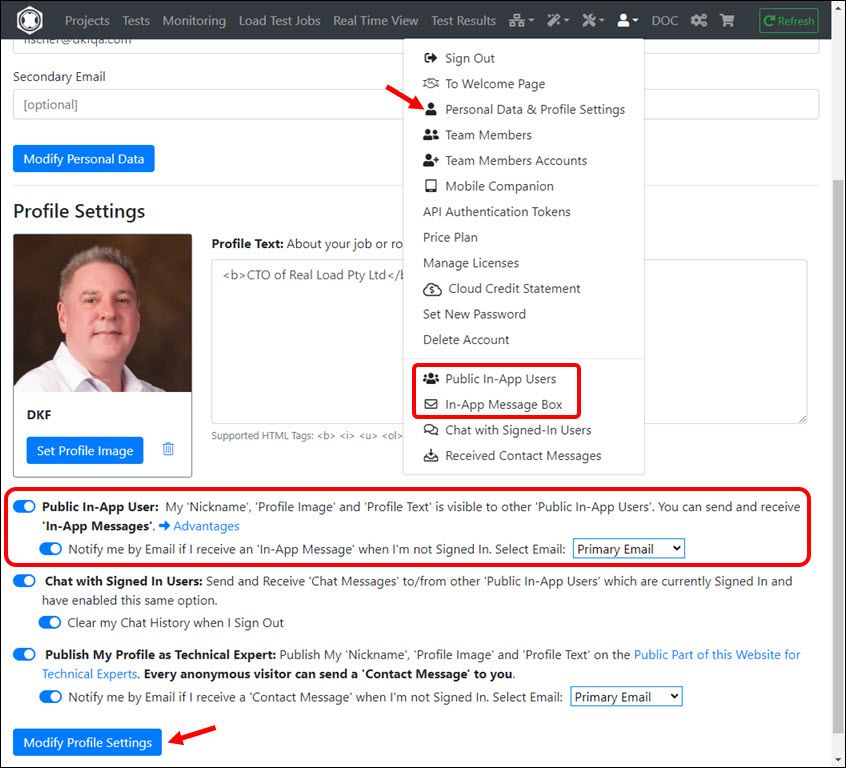
- Personal Data & Profile Settings : Here you can edit your personal data and also determine whether parts of it are publicly displayed in the portal.
- Team Members : Displays the list of all team members.
- Team Members Accounts : Management of team member accounts by the main user account. Team members have no access to this submenu.
- Mobile Companion : Displays a list of all mobile devices that have logged in to the portal using the Mobile Companion App. Furthermore, all push notifications that were sent to the mobile devices are displayed.
- API Authentication Tokens : Here you can create and manage authentication tokens that are used for authentication against the portal server API.
- Price Plan : Displays your current price plan and your access permissions to RealLoad resources.
- Manage Licenses : Displays your purchased licenses and allows you to add additional licenses and cloud credits.
- Cloud Credit Statement : Displays your Cloud Credit balance and a list of all Cloud Credit transactions.
- Set New Password : Here you can set a new password for your portal account.
- Delete Account : This will permanently delete your account in the portal - including deleting all data associated with your account.
The following submenus are only accessible depending on your configured “Personal Data & Profile Settings”:
- Public In-App Users : Displays a list of all portal users which are visible to other portal users. You can also contact them within the portal. This list is only shown if you are also a public portal user yourself.
- In-App Message Box : Here you can sent and display received messages to/from all portal users which are visible to other portal users.
- Chat with Signed-In Users : Opens the chat popup that allows chatting with other in the portal signed in users who have enabled this functionality in their profile settings.
- Received Contact Messages : If you have enabled “Publish My Profile as Technical Expert:” in your profile settings then all received contact messages will be displayed here.
Downloading RealLoad Components and RealLoad Libraries Java Doc

Clicking this icon will open a new browser window or tab to download.realload.com
Purchase of Licenses and Cloud Credits

Clicking this icon will open a new browser window or tab to shop.realload.com
Here you can Purchase Licenses and additional Cloud Credits.
If you have any questions, please email us at support@realload.com
1 - AWS Measuring Agents
How to launch AWS based Measuring Agents
This document describes how to launch Measuring Agents in AWS as EC2 instances. Readers are assumed to be familiar with AWS EC2 terms used in here, in particular if launching Measuring Agents manually.
AWS based Measuring Agents can be launched in three ways:
- Via the RealLoad Portal
- Via our Desktop Companion App
- Via the AWS Console
1. Launching AWS Measuring Agents via the RealLoad Portal
Launching AWS Measuring Agents via the RealLoad portal is the easiest of the three options. You don’t need an AWS account for this, but RealLoad ‘Clouds Credits’ are required.
If you run out of Cloud Credits, you can purchase new ones in the RealLoad Shop: https://shop.realload.com/
Automatic Termination after Certain Time
EC2 instances that are started using Cloud Credits are automatically terminated after a certain time (1 to 24 hours). On the one hand, this protects you from unnecessarily losing costs of Cloud Credits, but on the other hand, you can only use such launched Measuring Agents for Load Test Jobs, but not for Synthetic Monitoring Jobs.
Launching an AWS Measuring Agent using Cloud Credits
Navigate in the Portal to ‘Measuring Agents & Cluster Controllers’.

Them click the AWS icon:

Click on the rocket icon of an AWS region:

Select the ‘AWS/EC2 Instance Type’ (in this example ’t3.xlarge’) and the number of hours until the instance will be terminated (in this example 3 hours). Then click on the ‘Launch Instance’ button:

You will then receive a confirmation notification that the instance has been started. Now you have to wait at least 40 seconds until the instance gets into the running state.

The Measuring Agent is now registered in the portal. You should then ‘Ping’ it to make sure it is functional. If the Ping fails, wait another minute and then try again.


Premature Termination of an Instance - Refund of Cloud Credits
In this example, the Measuring Agent (cloud instance) was started for three hours, but the load test was performed successfully after just one and a half hours.
In order to save Cloud Credits, the instance can be terminated early.
To terminate an instance launched by Cloud Credits navigate to ‘Launched Cloud Instances’:

At the relevant instance, click the ‘Terminate Instance’ icon:

Click the ‘Terminate Instance’ button:

The instance will now terminate. In this example you will receive 4 out of a total of 12 cloud credits back.

Verifying the Cloud Credit Billing
Navigate to ‘Cloud Credit Statement’ to check your Cloud Credit Balance and Transactions:


2. Launching AWS Measuring Agents via the Desktop Companion App
Launching AWS Measuring Agents via the Desktop Companion App requires that you have an AWS account.
No additional costs (beyond the costs charged by AWS) apply when using our Measuring Agent images.
Note that you need the rights to log in to the AWS Console to check whether all Measuring Agent instances that are no longer needed have been terminated.
First download, install and configure the Desktop Companion. The download links are published on https://download.realload.com
Configuring the Desktop Companion
To configure the Desktop Companion for launching AWS Measuring Agents you need:
- An AWS ‘Access Key’ of an AWS User which have the permission AmazonEC2FullAccess
- A RealLoad ‘API Authentication Token’
To generate a RealLoad ‘API Authentication Token’ sign in to the RealLoad Portal and navigate to ‘My Account’ - ‘API Authentication Tokens’:

Click the ‘Add API Authentication Token’ button:

Enter as purpose ‘Desktop Companion’ and click the ‘Add API Authentication Token’ button. Then copy the shown Token Value to the clipboard or to a text editor:

Now start the Desktop Companion and configure it. Click on the File tab and then click Settings.

In the General Tab enter:
- The Agent Secret: This is something like a password that protects the launched AWS Measuring Agents from unauthorized access. You can enter any text here, but it must not be empty.
- The Portal URL: This is the URL of the Portal Server API and should always be https://portal.realload.com/RemoteUserAPI
- The Authentication Token: Enter here the RealLoad ‘API Authentication Token’.
- Set the Refresh Interval to a value that is greater than 60 seconds.
Then click the ‘Test’ button near ‘Authentication Token’:

Switch then to the AWS Tab and enter:
- The AWS Access Key ID
- The AWS Secret Access Key
- The Preferred Instance Type: We recommend that you enter t3.medium for your first attempt.
- Set the AWS EC2 Refresh Interval to a value that is greater than 60 seconds.
- Select at My AWS Regions your preferred AWS region(s): Multiple regions can be selected by CTRL-mouse-click. We recommend that you select eu-central-1 and/or us-west-1 for your first attempt.
Then click the ‘Test’ button near ‘AWS Secret Access Key’:

Finally, click the ‘OK’ button. The configuration is now complete.
Launching an AWS Measuring Agent
In the Desktop Companion, go to the AWS tab and select an AMI of type ‘MA’ (MA = Measuring Agent). Then launch the instance with a right mouse click:

A window will appear in which you can check the configuration of the instance and set the instance auto-terminate time period.
You can also choose a value of zero for the auto-terminate time period, which means that the instance will continue to run until you stop it.

Important NOTE
For technical reasons, it may happen that a Measuring Agent instance was not automatically terminated.
You must therefore double-check at the end of each working day whether all Measuring Agent instances that are no longer needed have actually been terminated.
Follow the instructions at Double-check no longer needed Instances
The instance is then launched and in the state ‘pending’:

Now wait until the instance reaches the ‘running’ state. Then register the instance in the portal with a right mouse click:

The instance is now also displayed in ‘Portal Agents Registration’:

Check in the RealLoad Portal whether the instance is running correctly by pinging the Measuring Agent at application level:


Terminating an AWS Measuring Agent
Note that this section only applies to Measuring Agent instance which have launched via the Desktop Companion.
Two steps are necessary to terminate an instance:
- Terminate the instance in AWS
- Deregister the Measuring Agent in the portal server
To terminate an instance in AWS, perform a right mouse click in the Desktop Companion - Running AWS Images in “My Regions” at the corresponding instance and select ‘Terminate’:

Listed Instances
Note that only instances running in the regions you’ve configured in the preferences window as “My regions” and tagged with the “REAL_LOAD_AGENT” tag will be listed.
The instance is then in the state ‘shutting-down’. Now you can deregister the Measuring Agent in the portal server by a right mouse click:

Double-check no longer needed Instances
Because the Desktop Companion only shows Running AWS Images in “My Regions”, some instances launched in other AWS Regions may not be displayed.
Sign in to the AWS console to review Measuring Agent instances across all AWS regions. Select EC2 Global View:

In EC2 Global View click Global search and select the the tag REAL_LOAD_AGENT:

Select the operator Equals and set the value to true, then hit the return key:

If the list displayed contains one or more instances, click on the instance(s):

Memorize the instance ID and terminate the instance:

Sign in into the RealLoad Portal and delete the corresponding Measuring Agent:

3. Launching AWS Measuring Agents via the AWS Console
In EC2, first select the AWS Region where you want to launch the Measurement Agent instance.
Creating the Security Group
In order for the AMI to be reachable from the RealLoad Portal you’ll need to configure a Security Group allowing inbound TCP/IP V4 connections to port 8080 as a minimum.
Optionally, you can also configure SSH access.
In the following example the security group “Real Load Agent Security Group” was created:

Launching a Measuring Agent Instance
When launching the instance click Browse more AMIs:

Then click Community AMIs, enter our (RealLoad) AWS account 775953462348 and select the Measuring Agent image:

Add the tag REAL_LOAD_AGENT = true

Select the Instance Type and set the (existing) Security Group “Real Load Agent Security Group”. Optionally you may also set a Key Pair:

Scroll down and click Advanced Details:

In Advanced Details scroll down to User Data.
In order to protect access to your Measuring Agent we strongly recommend setting a non-default secret when launching the instance.
The secret can be set at launch time by providing User Data to the AMI as follows (replace “secret” with the secret of your choice):
#!/bin/sh
echo "AGENT_SECRET=secret" > /home/ec2-user/agent_secret.sh

Scroll down to the bottom of the AWS Console and click Launch Instance:

After launching the instance click on the instance ID:

Copy the Public IPv4 address of the instance to a text editor or to the clipboard:

Sign In to the RealLoad Portal and add (=register) the Measuring Agent instance:

The Agent IP Port wil always be 8080. Enter the Auth Token which you have set as AGENT_SECRET when launching the instance.

Then ping the Measuring Agent at application level:


And check the Measuring Agent Log File to verify that the Agent Secret was configured:


The Measuring Agent is now ready for operation. Don’t forget to terminate the instance when you no longer need it.
Once you have terminated the instance, you should delete the corresponding Measuring Agent in the RealLoad Portal.
2 - Recording of a Web Surfing Session
Recording and Post-Processing of a Web Surfing Session
This document describes how a Web Surfing Session can be recorded by using a HTTP/S Remote Proxy Recorder and then post-processed in the HTTP Test Wizard. After post-processing, a RealLoad Test can be generated.
Preconditions
The following assumes that a Firefox web browser is used for recording and that the CA Root Certificate of the HTTP/S Remote Proxy Recorder has already been imported into Firefox.
You must also have the ‘RealLoad Test Recorder’ browser extension installed in Firefox. It is recommended to only turn on this browser extension when recording a Web Surfing Session.
Preparing Firefox for Recording
The following text describes how to copy and paste a HTTP/S Remote Proxy Recorder Configuration into the Firefox ‘RealLoad Test Recorder’ browser extension.
You now need two web browsers from different manufacturers:
- The Firefox browser
- A Chrome browser that is signed-in into the RealLoad portal
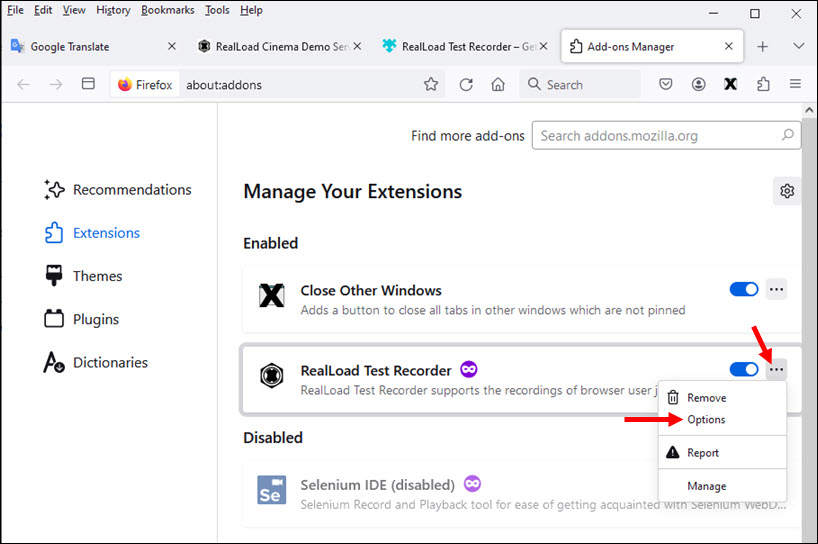
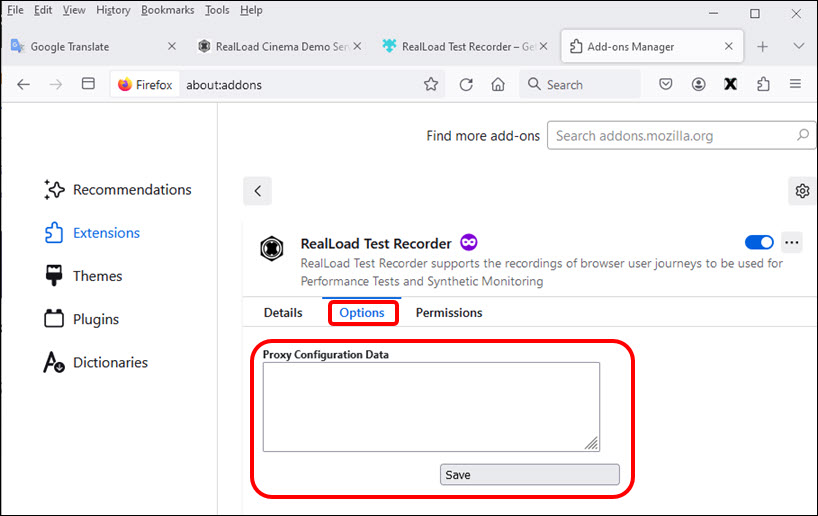
In Firefox navigate to Manage Extensions

At the RealLoad Test Recorder extension click Options


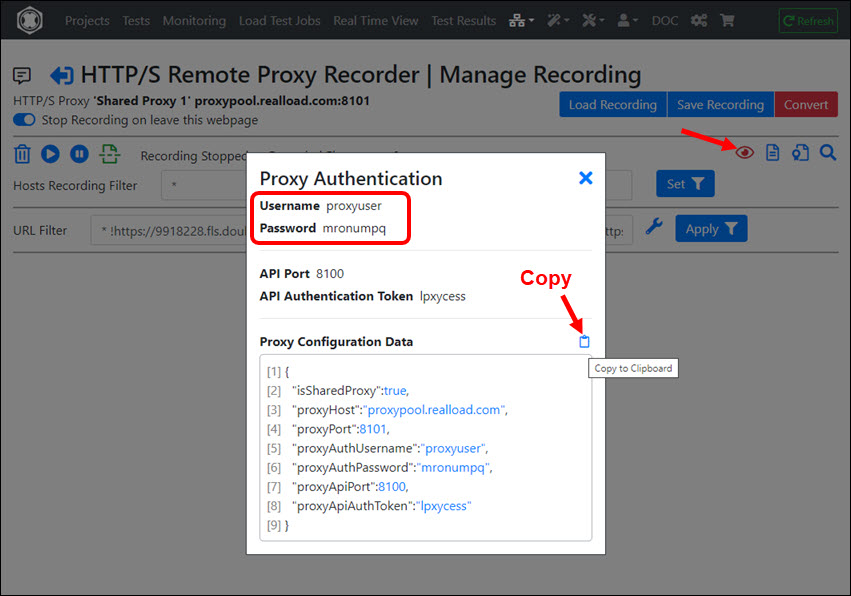
Now use the Chrome browser, sign in to the RealLoad portal, navigate to the HTTP/S Remote Proxy Recorders menu, and Connect to the Proxy Recorder

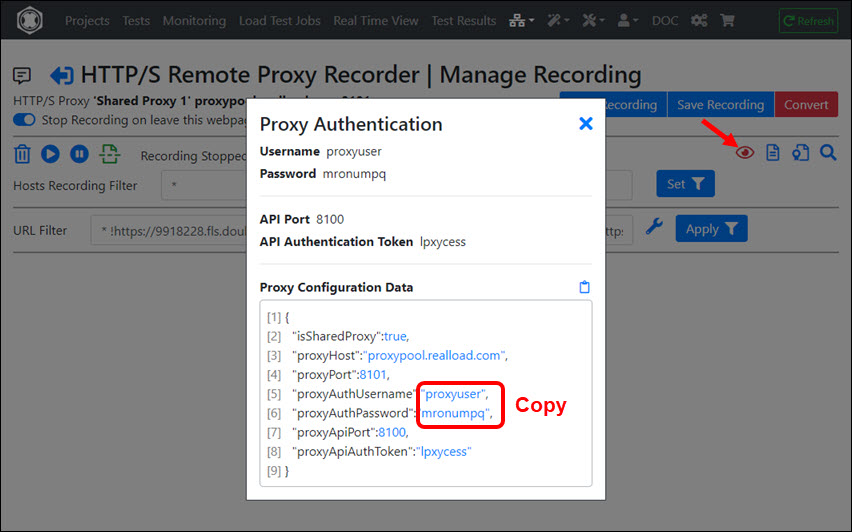
After you are connected to Proxy Recorder with the Chrome browser, click on the ‘Red Eye Icon’ and copy the ‘Proxy Configuration Data’ to the Clipboard by clicking the corresponding icon

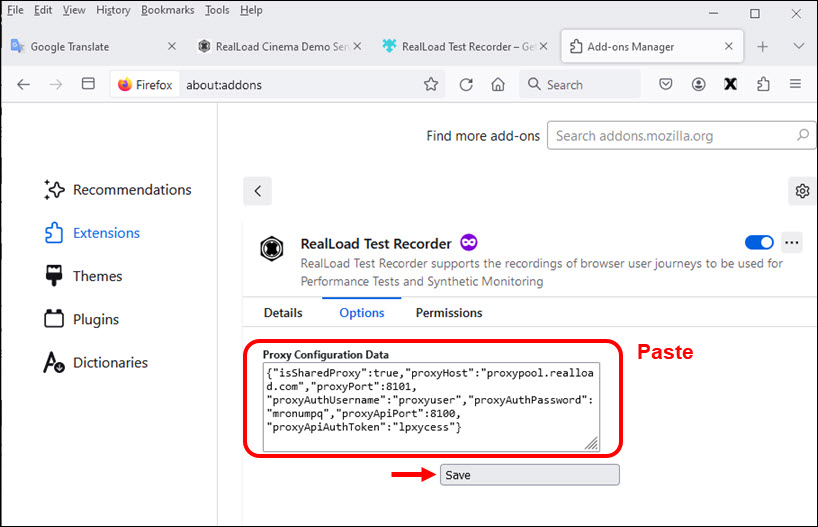
Then paste the ‘Proxy Configuration Data’ to the Firefox ‘RealLoad Test Recorder’ browser extension and click ‘Save’

Firefox is now ready for recording.
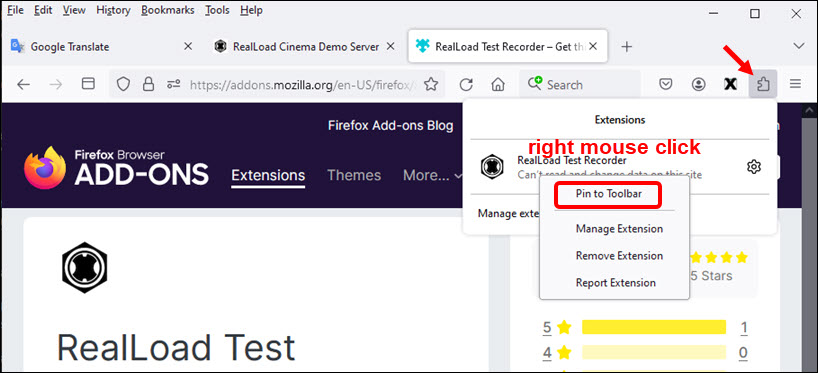
Tip: You can also Pin the ‘RealLoad Test Recorder’ browser extension to the Firefox Toolbar:


Recording a Web Surfing Session
The following example shows the recording of the purchase of a Cinema Voucher in the RealLoad Cinema Demo Shop.
cinema.realload.com is a public server available to you for educational purposes.
In the Chrome browser connect via portal to the Proxy Recorder and click on the ‘Red Eye Icon’:

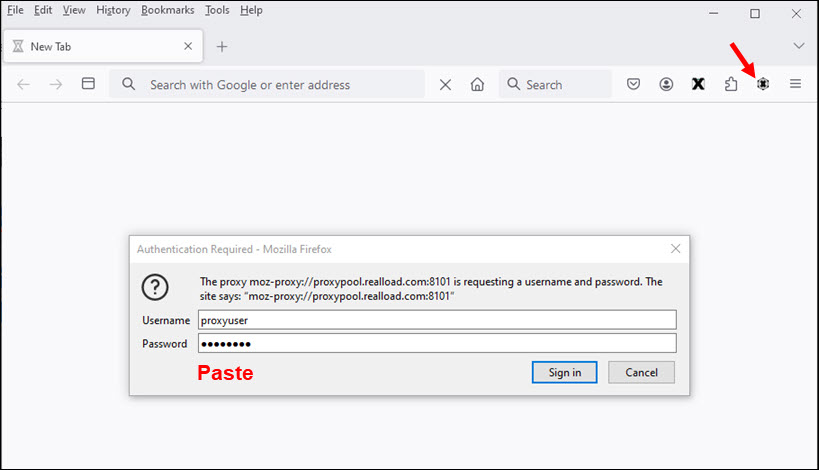
In Firefox click the ‘RealLoad Test Recorder’ browser extension. When you are asked for the Proxy Authentication then paste the username and password shown in Chrome.

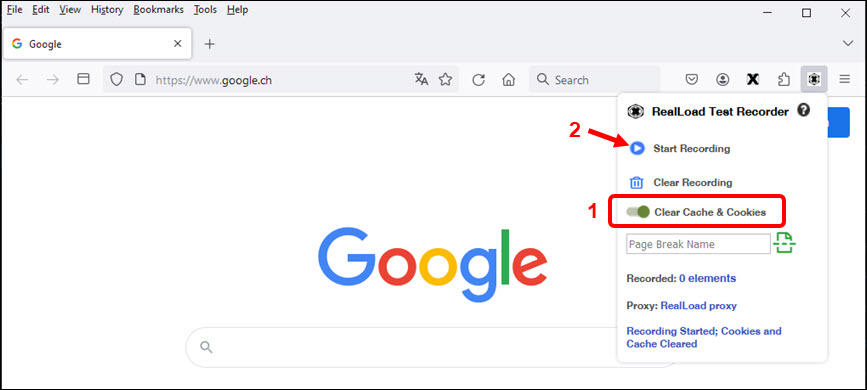
In the ‘RealLoad Test Recorder’ browser extension first enable Clear Cache & Cookies and then click Start Recording

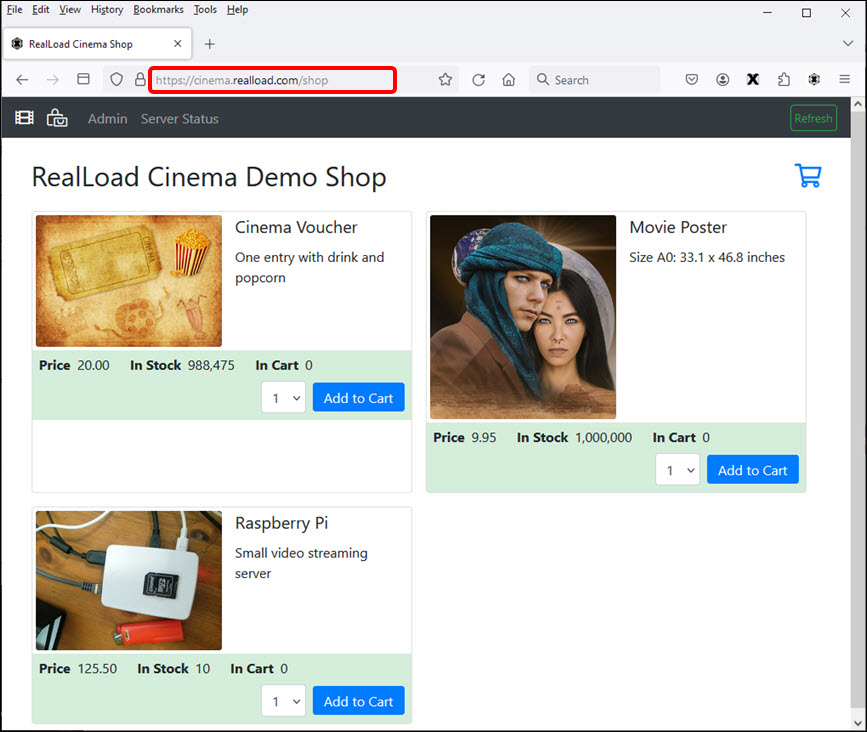
In Firefox enter the URL https://cinema.realload.com/shop which is the starting point of the recorded session.

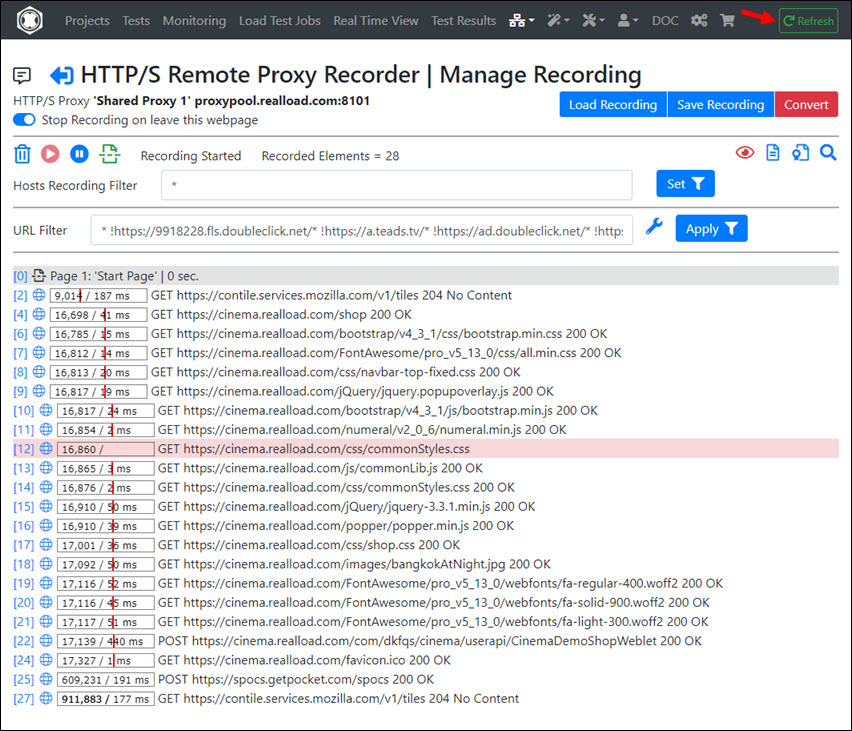
Optional: Have a look at Chrome and you will see that the first web page is recorded:

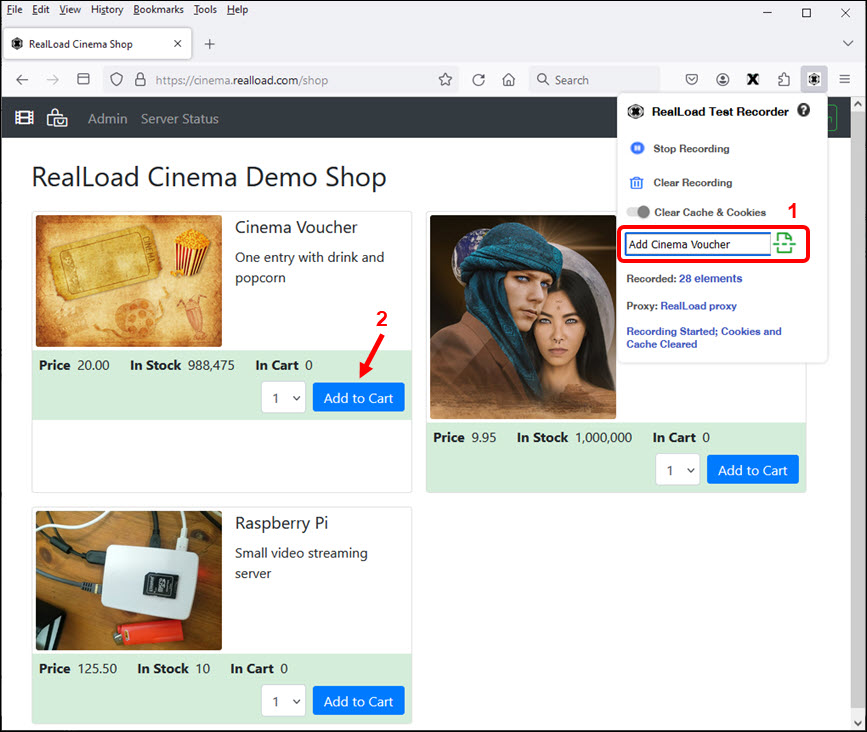
A cinema voucher will now be added to the shopping cart.
In Firefox first insert a ‘Page Break’ with the comment ‘Add Cinema Voucher’, and then click on ‘Add to Chart’ in the shop:

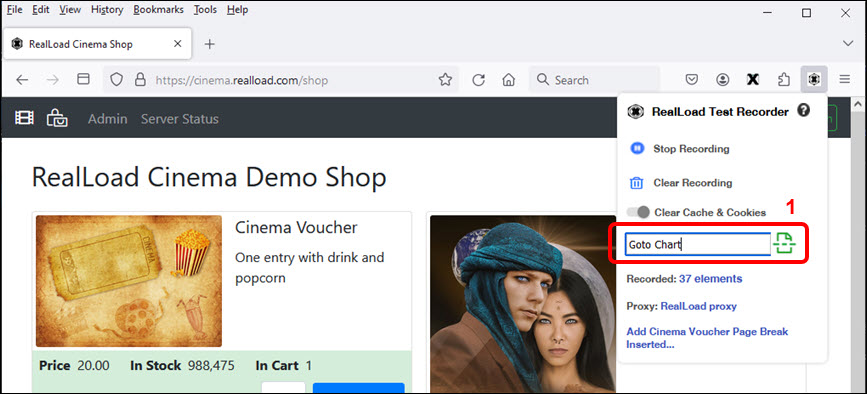
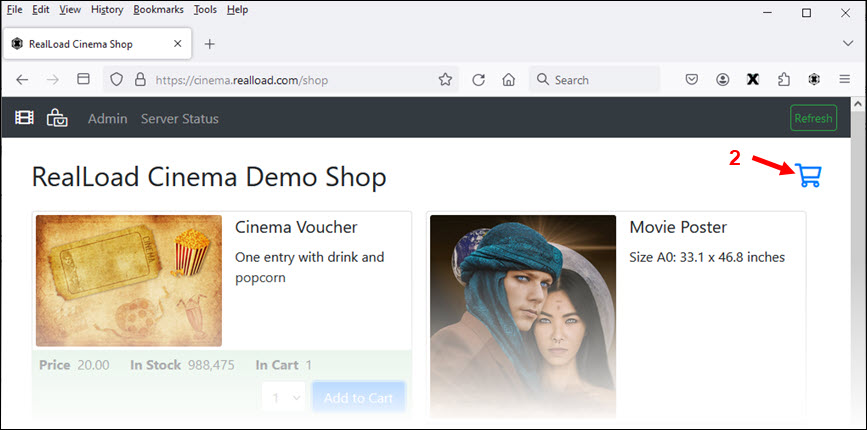
Add another Page Break with the comment ‘Goto Chart’, and then click the Cart Icon:


The shopping cart is now displayed.
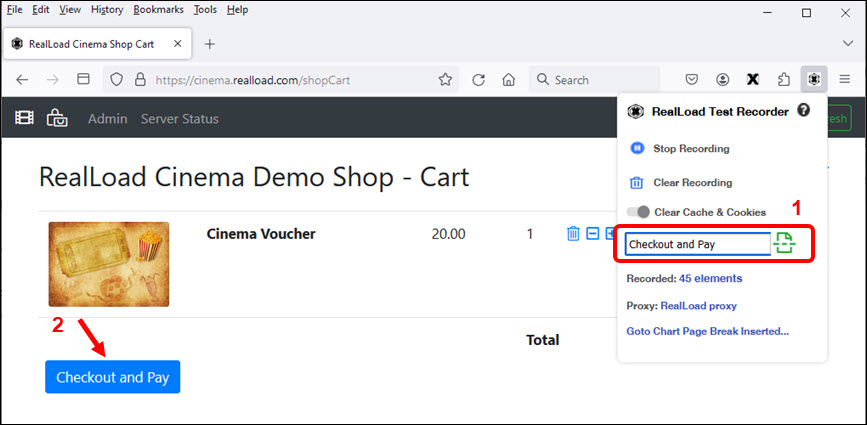
Add another Page Break with the comment ‘Checkout and Pay’, and then click ‘Checkout and Pay’:

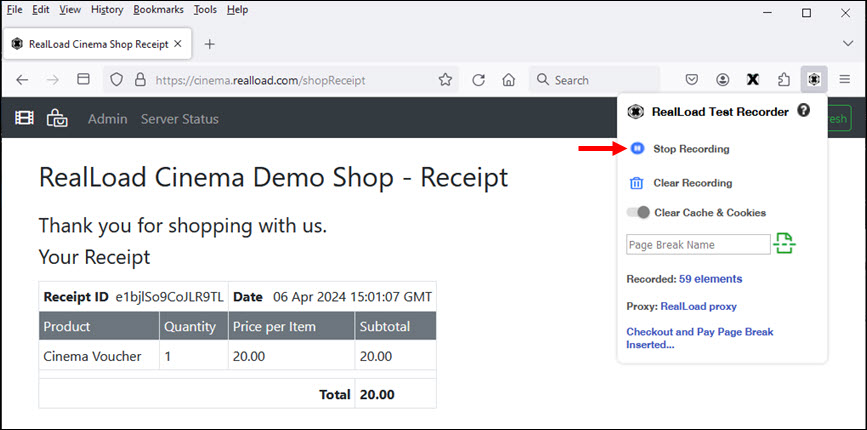
The receipt will be displayed and the recording is now complete.
Tip
As you have seen in the previous steps, a Page Break is always added first before you click on something in the browser or submit a form. This is important because your test and its results are then are divided into individual web pages.
In the ‘RealLoad Test Recorder’ browser extension, click Stop Recording:

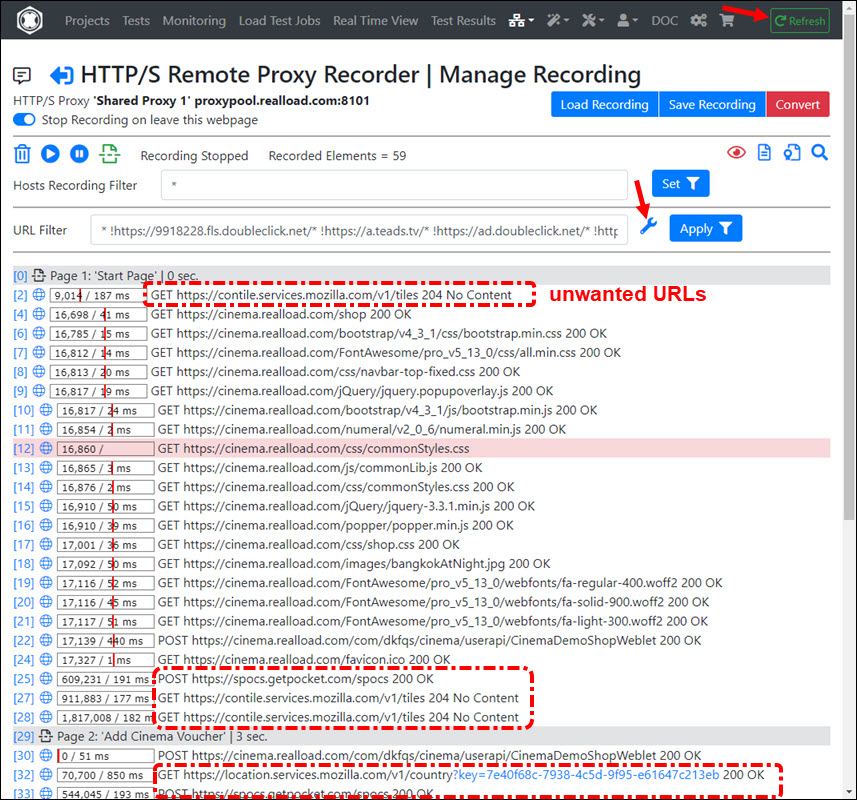
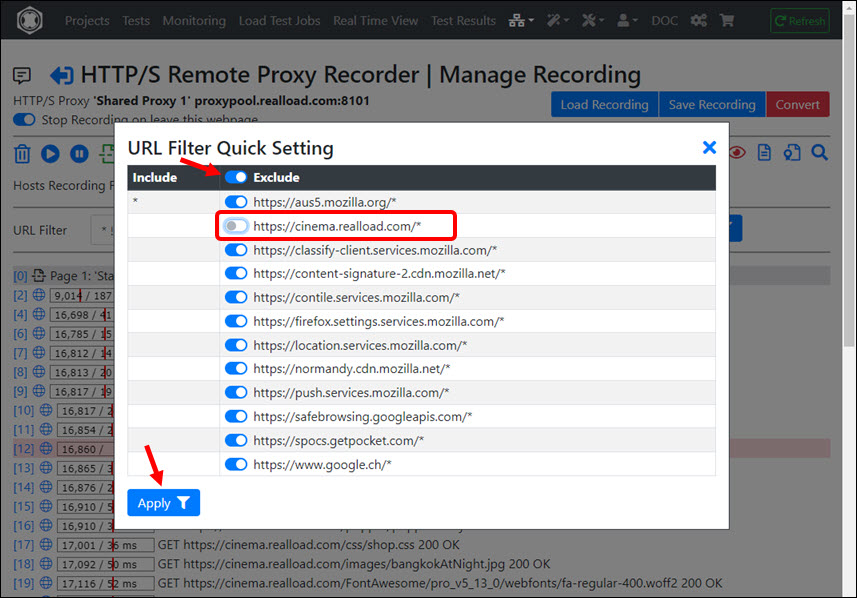
Now return to the Chrome browser and click on ‘Refresh’. As you can see, a lot of URLs were recorded that were unwanted in your test. Click on URL Filter - Quick Settings to filter out the unwanted URLs:

Exclude any web servers that you do not want to be part of your test. In particular, you should exclude any tracking servers.

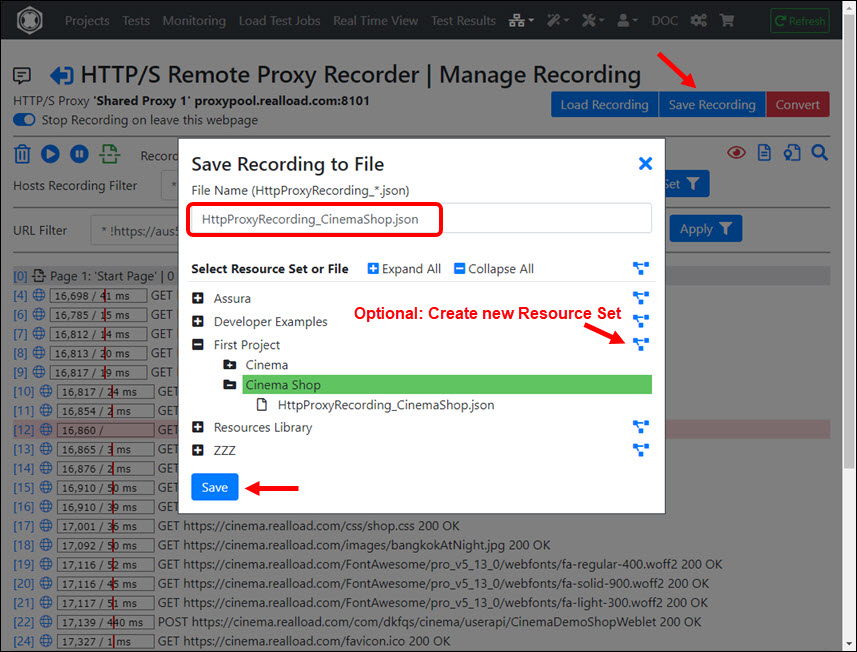
Then save the recorded session. You can later re-load the recorded session to (any) proxy recorder and filter it again:

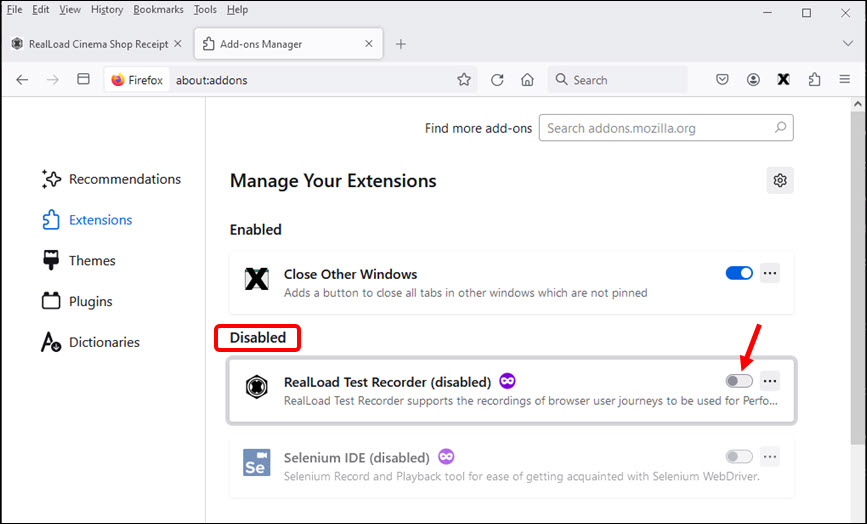
After completing the recording, it is strongly recommended to switch off the ‘RealLoad Test Recorder’ browser extension. Only turn this browser extension on again when you record a new web surfing session.

Converting the Recording to an HTTP Test Wizard Session
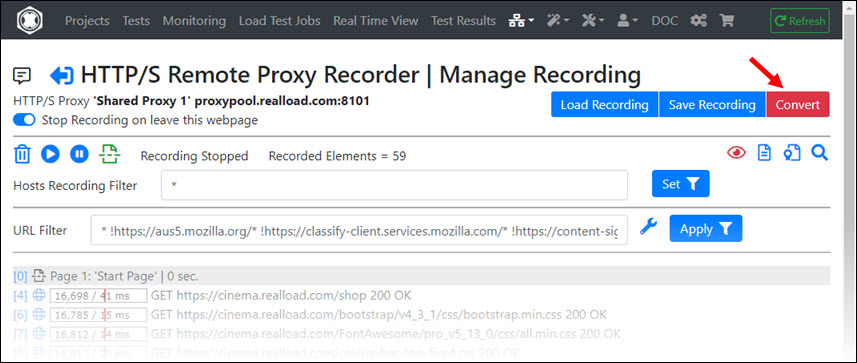
In the HTTP/S Remote Proxy Recorder click ‘Convert’

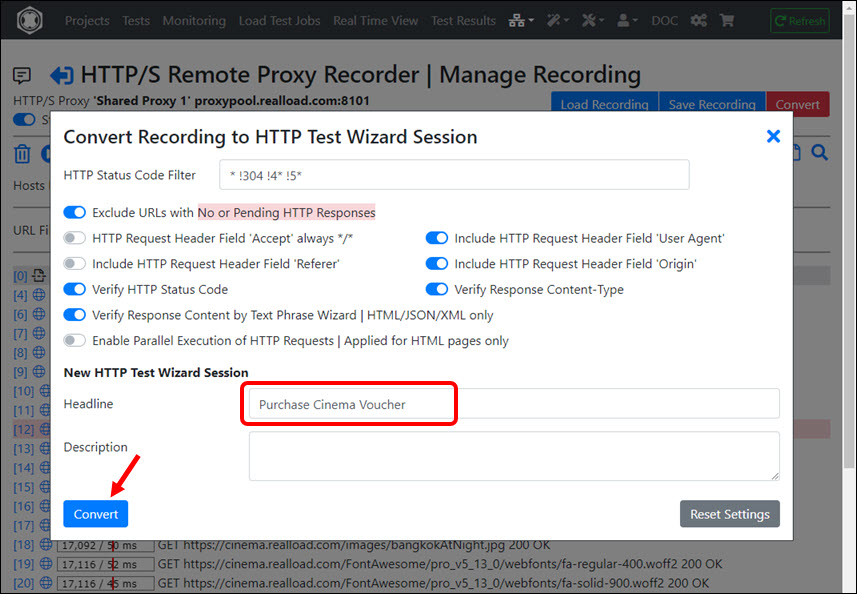
Enter the Headline of the HTTP Test Wizard session (in this case ‘Purchase Cinema Voucher’) and click ‘Convert’:

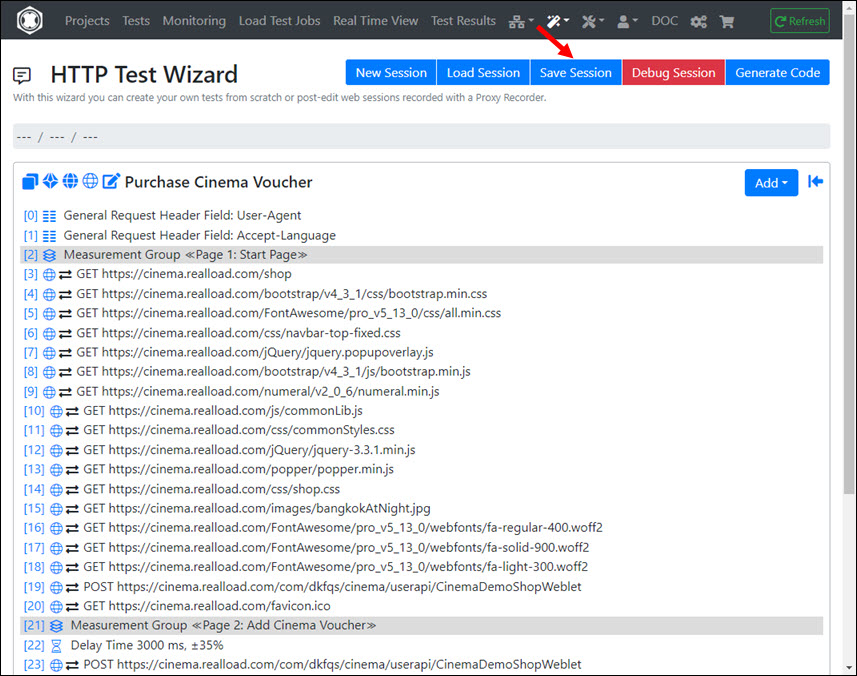
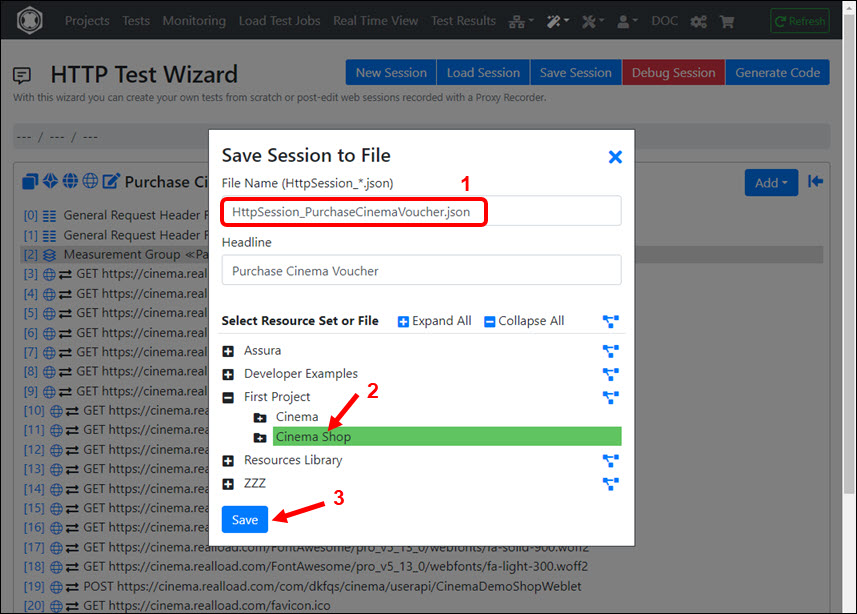
The recording will now be converted and appears in the HTTP Test Wizard. We recommend that you save the HTTP Test Wizard session first before you start post-processing.


Post-Processing of the HTTP Test Wizard Session
Handling of Dynamic Session Values
If a dynamic value such as a order number is part of an HTTP response, and that value is then used in subsequent HTTP requests, you must handle this value using a dynamic session variable.
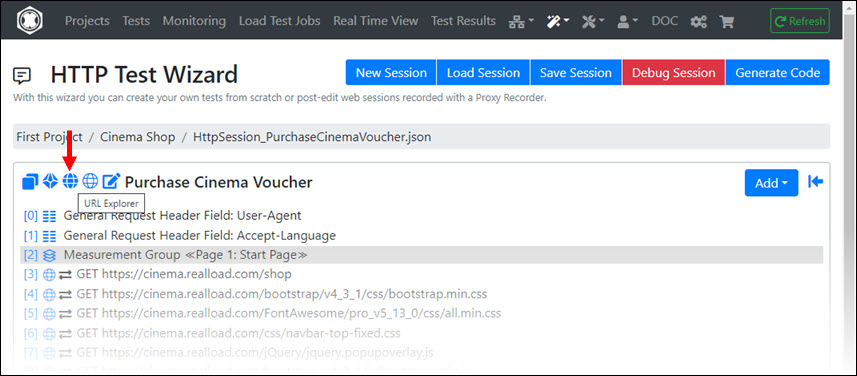
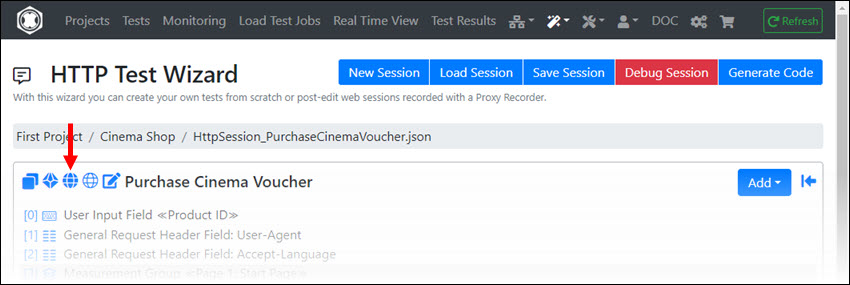
To identify such dynamic values, you can use the Variables Wizard, which you can access via the HTTP Test Wizard. First click on URL Explorer

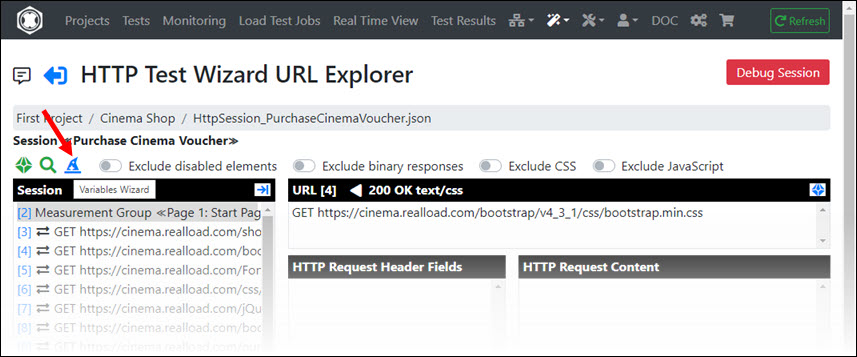
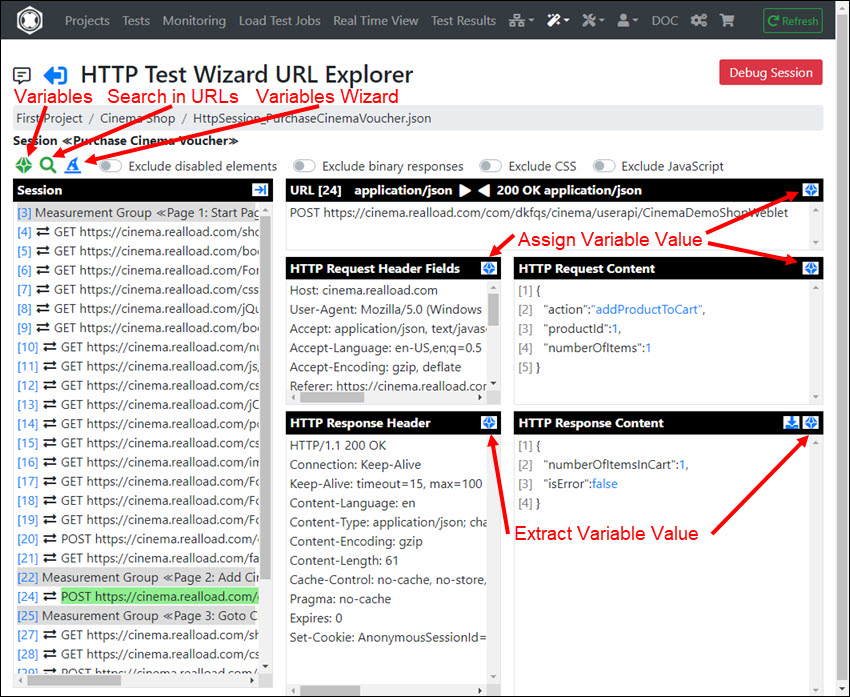
Then in the URL Explorer click Variables Wizard

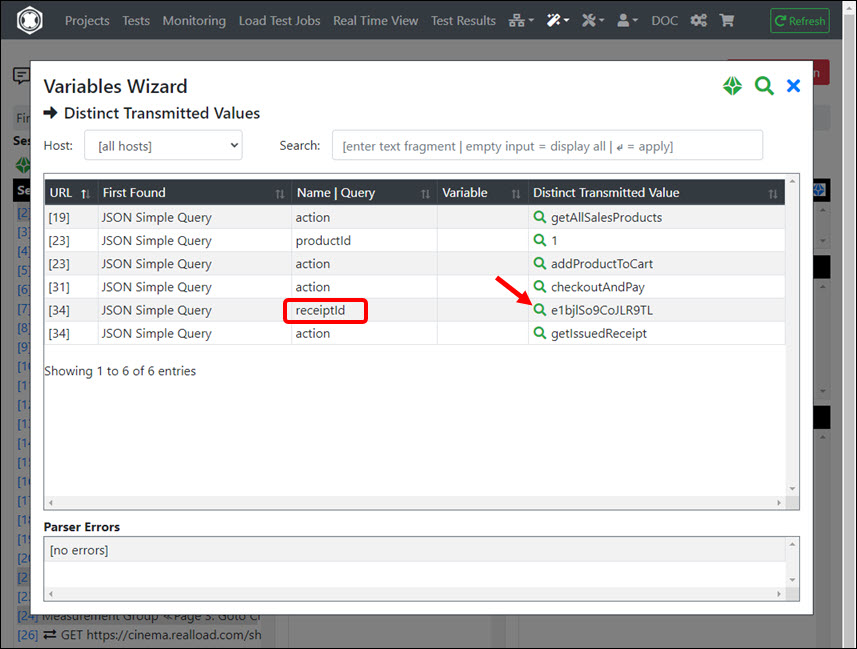
Now a list of Distinct Transmitted Values is shown in the Variables Wizard, which is extracted from all HTTP request of the session. The challenge now is to estimate which of these values are dynamic (static values do not need to be handled).
As a rule of thumb:
- if the value is a simple speaking word, or a combination of simple speaking words, or a small number, it is probably a static value.
- However, if the value is a complex, random string, it is probably a dynamic value.
In the image below there is only one dynamic value (receiptId = e1bjlSo9CoJLR9TL). Click on the magnifying glass icon to handle this value:

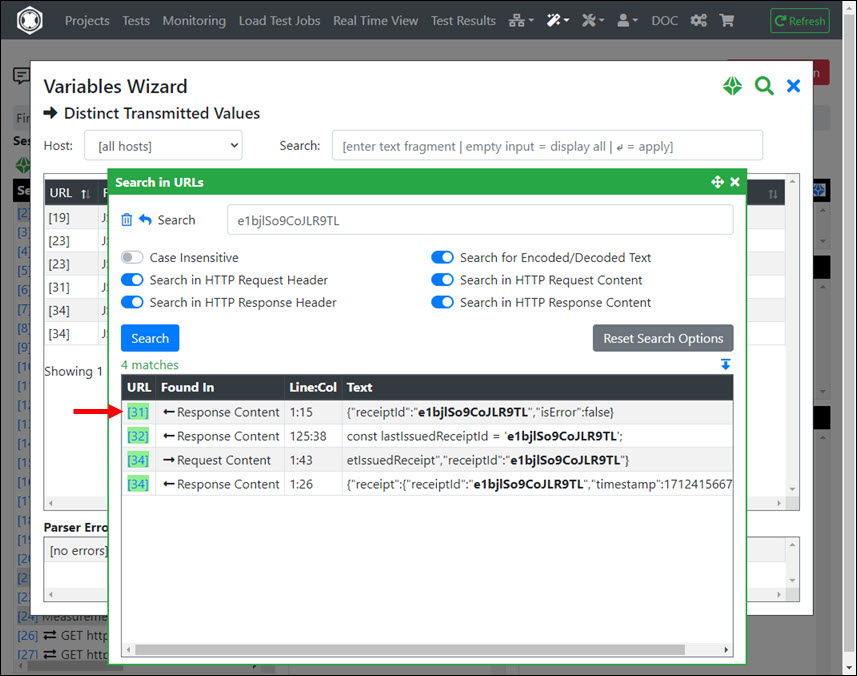
The session is now searched for this dynamic value e1bjlSo9CoJLR9TL. Click on the first search result of an HTTP response:

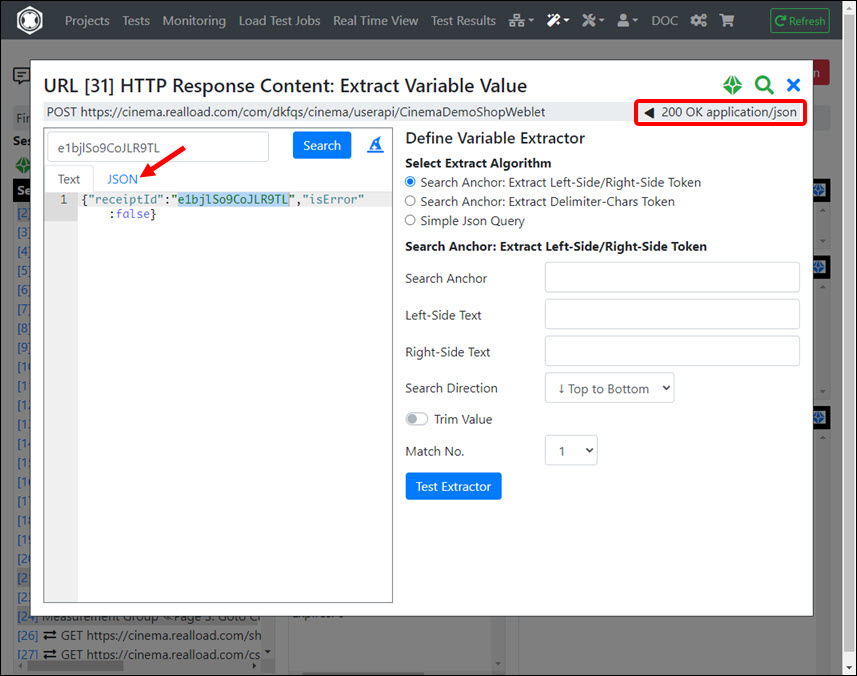
In this example, the HTTP response is in JSON data format. So click on the JSON tab:

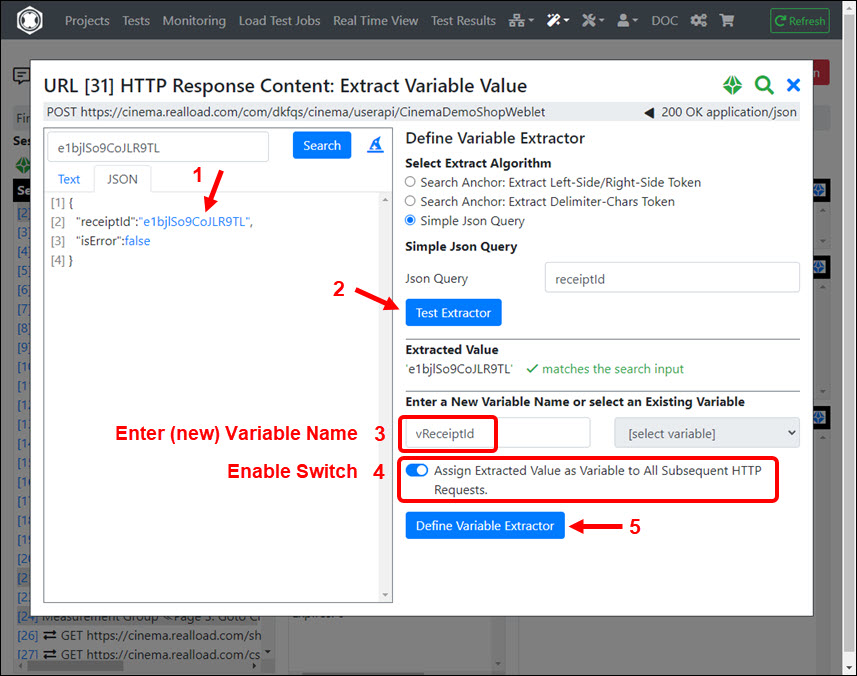
Then click on the value of receiptId, and then click Test Extractor and enter a new Variable Name ‘(vReceiptId’ in this case). Finally enable the switch Assign Extracted Value as Variable to All Subsequent HTTP Requests and click the Define Variable Extractor button.

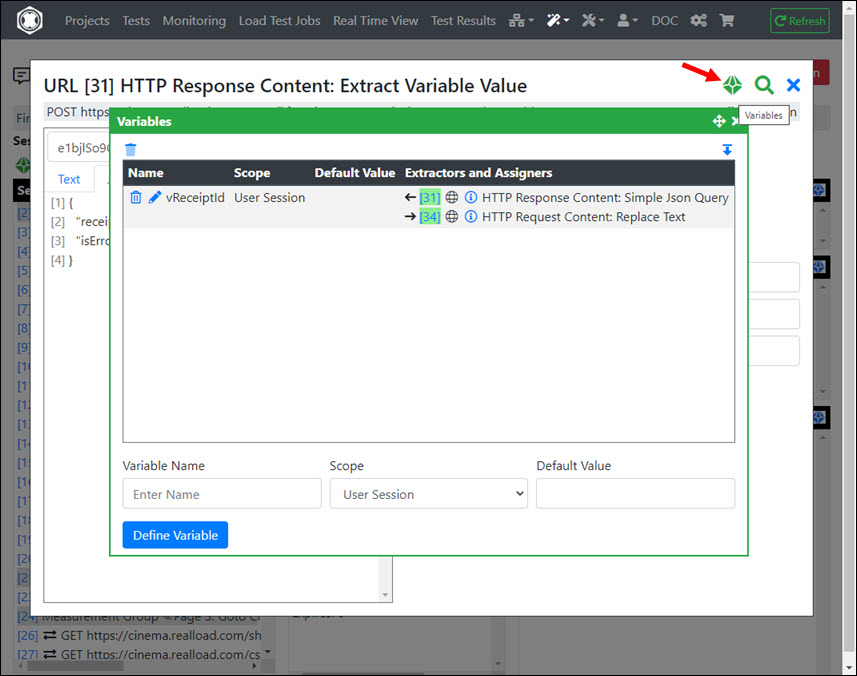
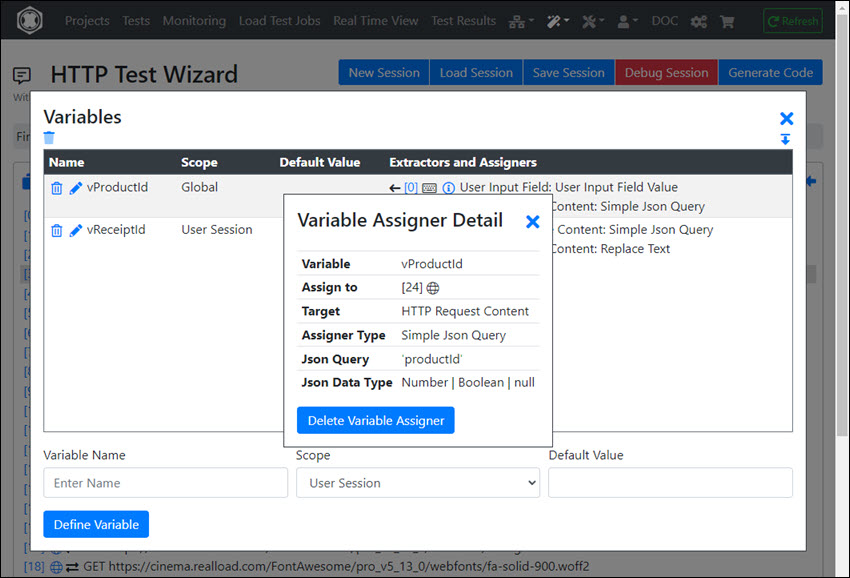
The handling of the dynamic session variable is now complete. Click the ‘Variables’ icon to check the variable extractor and variable assigners:

After you have processed all dynamic values, you should save the session again.
Reviewing the HTTP Response Content Validations
When the recording was converted, the verification of the HTTP responses were also automatically configured.
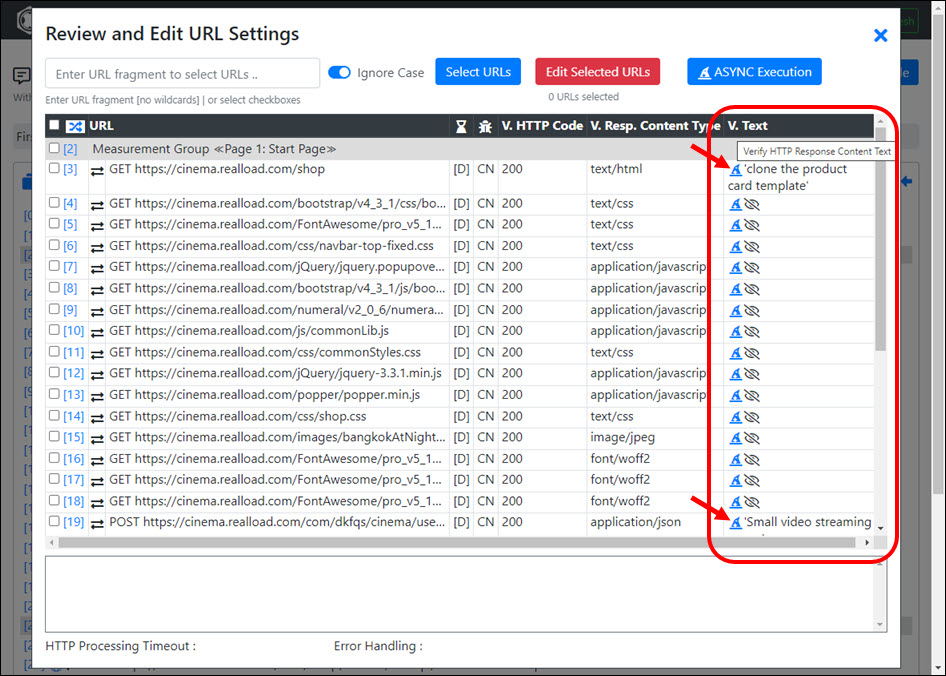
The received HTTP status code of each URL is always checked for the value it had at the time of recording. However, some URLs may also be automatically configured to additionally validate the response content against a text fragment. You should review these URL-specific text fragments and correct them if necessary.
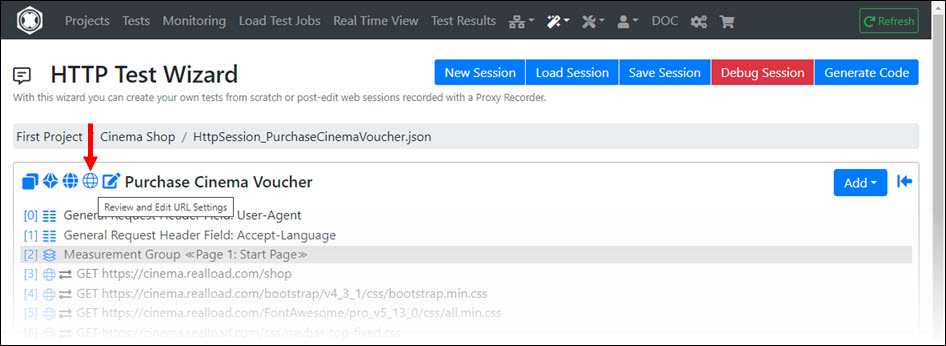
In the HTTP Test Wizard click on Review and Edit URL Settings

Take a look at table column ‘V. Text’ and click on the text fragment wizard icons:

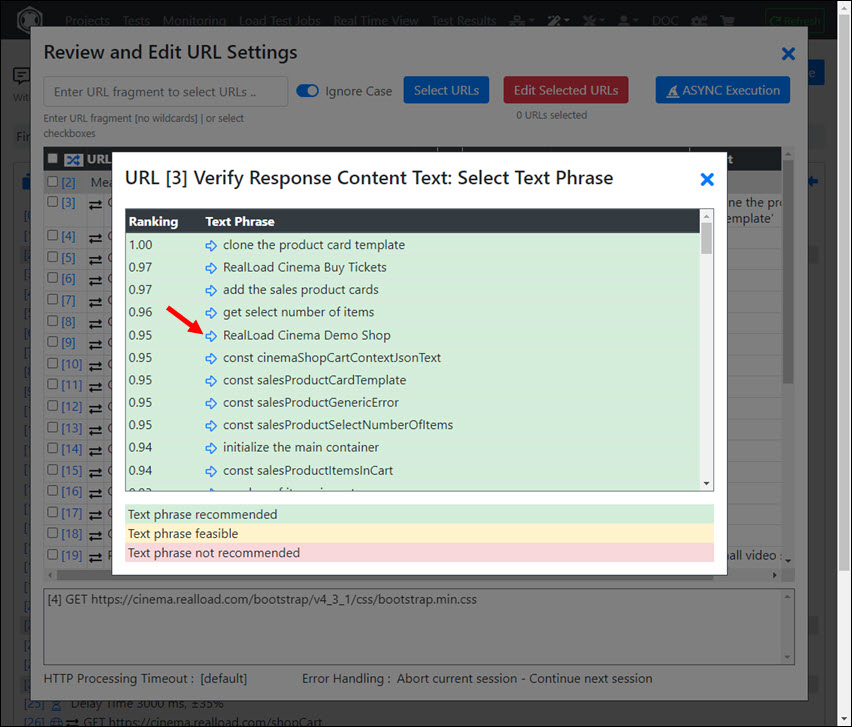
For example, for the URL https://cinema.realload.com/shop, it is better to choose the text fragment ‘RealLoad Cinema Demo Shop’ instead of ‘clone the product card template’:

After you have reviewed the content validations of the HTTP responses, you should save the session again - if you have made any changes.
Debugging an HTTP Test Wizard Session
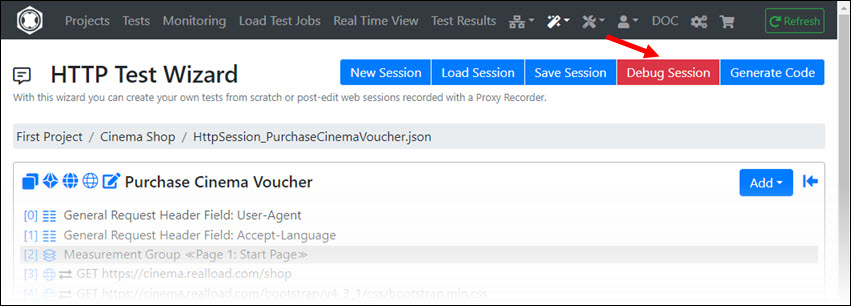
After you have completed the post-processing, we recommend that you debug the HTTP Test Wizard session.

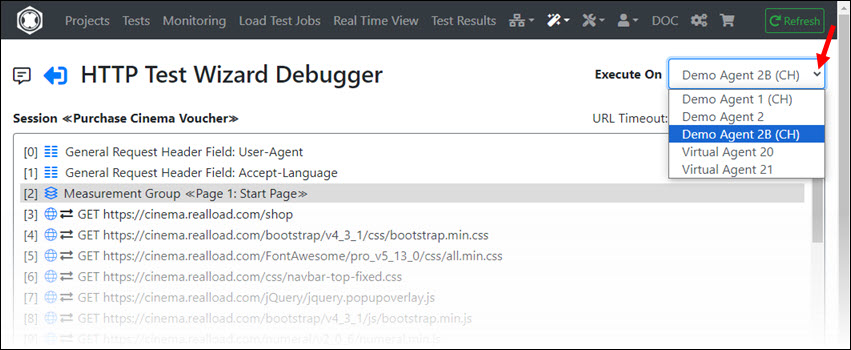
Since this is a Remote Debugger, you can choose which Measuring Agent the debugger runs on. This means you can also debug the session from different geographical locations.

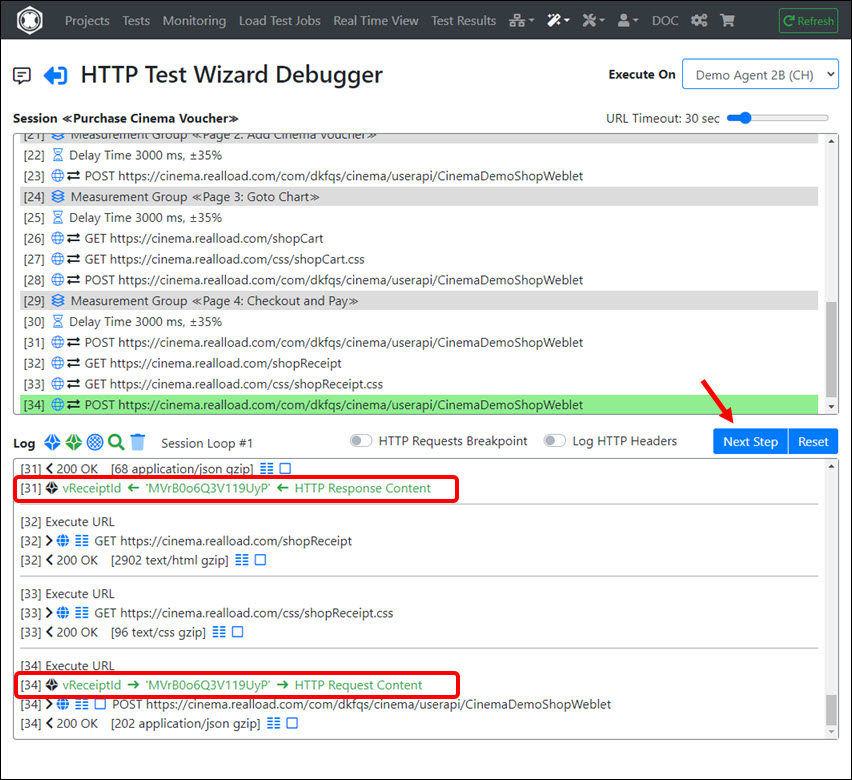
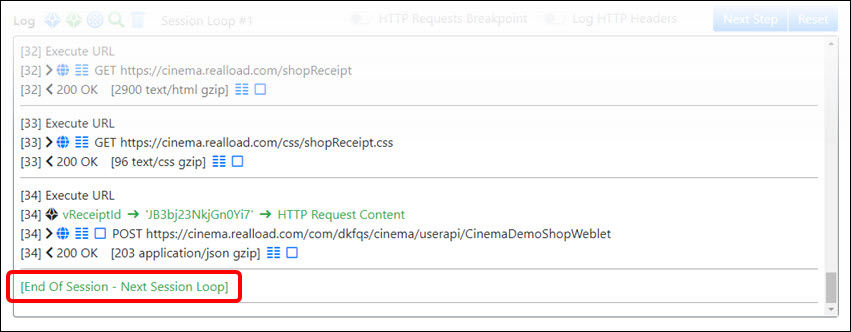
Click on ‘Next Step’ until you reach the end of the session - or until an error is displayed. During debugging you will also see when the value of dynamic session variable is extracted from an HTTP response and when it is assigned to an HTTP request.


Generating a RealLoad ‘Test’ from an HTTP Test Wizard Session
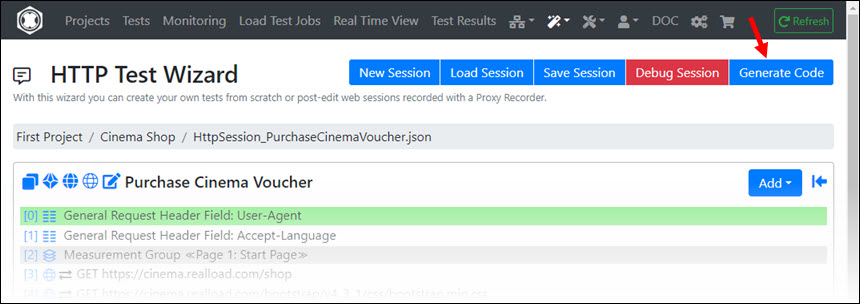
If you were able to debug the session without errors, you can now generate a RealLoad Test from it. Click on ‘Generate Code’:

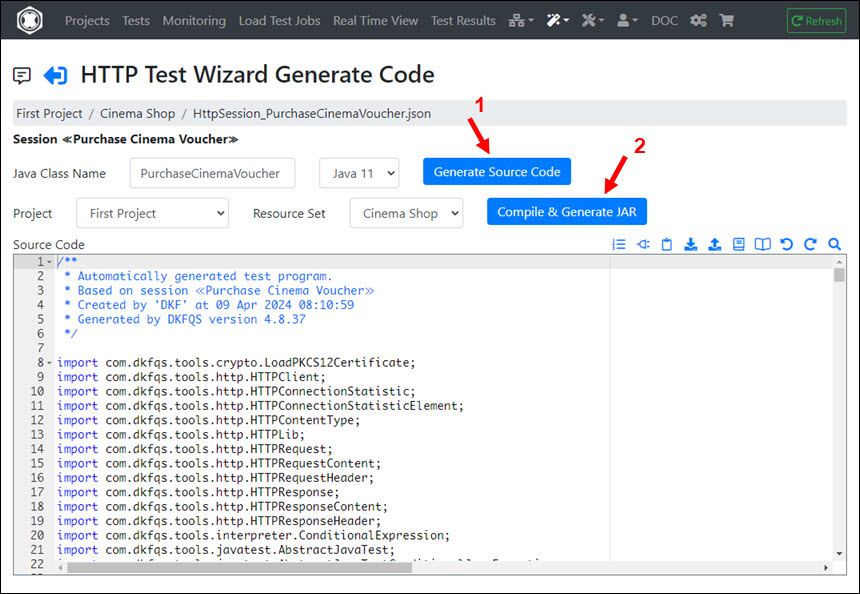
First click on ‘Generate Source Code’ and then on ‘Compile & Generate JAR’:

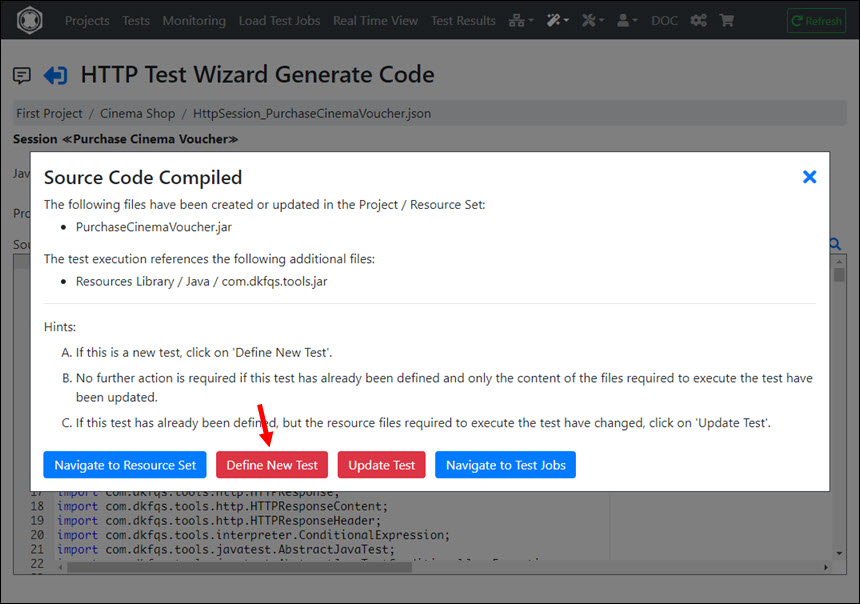
Then click ‘Define New Test’:

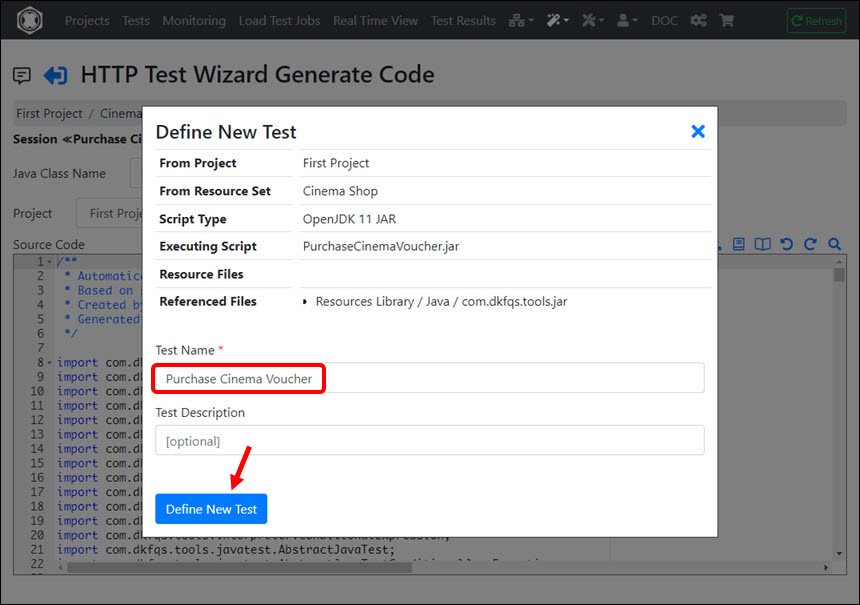
You can adjust the name of the test a little (it can also contain spaces). Then click on ‘Define New Test’:

Your browser will now be redirected to the ‘Tests’ menu and the test will appear at first position (if the sorting is set to descending test ID).

From here you can continue as described at the Tests Menu.
3 - HTTP Test Wizard
User Guide | HTTP Test Wizard

Overview and Functionality
The HTTP Tests Wizard supports you to create sophisticated tests in an easy way. You can:
As the name suggests, the HTTP Tests Wizard is optimized for the execution of HTTP/S tests.
However, by using HTTP Tests Wizard Plug-Ins, any other protocols can also be tested and measured (similar to JUnit Tests).
HTTP Tests Wizard Features:
- No programming required (except for self written plug-ins). You can create your test through the powerful user interface by assembling all required functionalities via simple dialogs.
- Variables can be defined and their values can be extracted and assigned directly via the user interface.
- A powerful debugger helps you to perfect your test.
- The defined test can be automatically converted into a performance-optimized RealLoad Test.
Background Information on the Technical Concept
The HTTP Test Wizard works on a purely abstract level, in that you only define high-level instructions in the user interface about what will be executed later during the test.
This also includes the remote debugger, which only executes the (codeless defined) instructions entered. After successful verification of a defined test using the debugger, a HTTP Tests Wizard ‘Session’ can be automatically converted into a performance-optimized RealLoad Test that is ready out of the box without the need for any manual programming.
Session and Session Elements
The test sequence is referred to as a so-called “Session”, whereby each simulated user repeatedly executes the session in a loop (so called “User Session” or “Session Loop”).

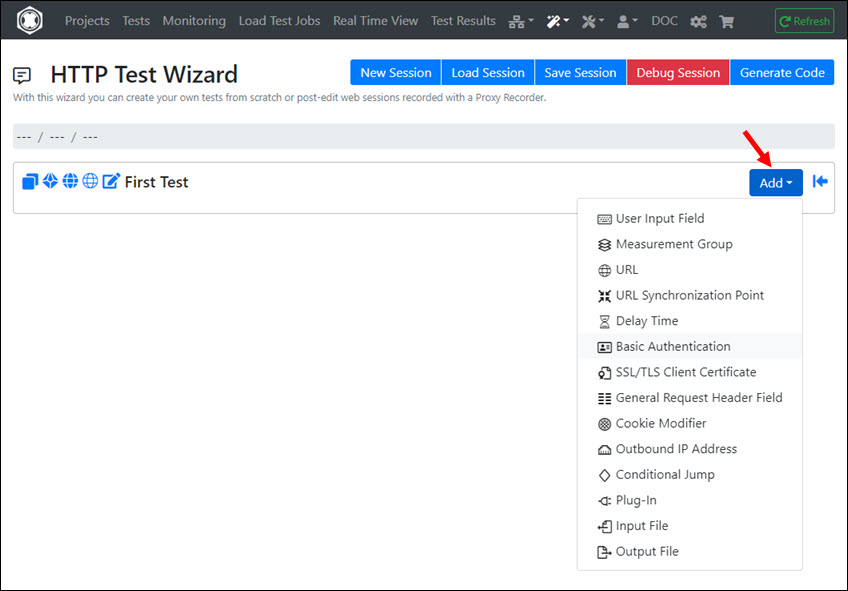
In order to define a test sequence, you can add various Session Elements to a session:
- User Input Field : An additional input field whose value can be entered when starting the test and that is defined as a global variable during the test.
- Measurement Group : Measures the execution time over several session elements.
- URL : Executes an HTTP request and receives and verifies the HTTP response. The URL can executed either synchronously or in parallel with other URLs. (see also URL Synchronisation Point). One or more “Bound to URL Plug-Ins” can also be added to a URL which, among other things, can modify the HTTP request and post-process the HTTP response.
- URL Synchronisation Point : Synchronizes URLs executed in parallel (waits until the last HTTP response has received).
- Delay Time : Delays the execution of the user session for an amount of time.
- Basic Authentication : Adds a Basic Authentication username and password to the URLs, for all Web servers or for a specific Web server.
- SSL/TLS Client Certificate : Adds SSL Client Certificate(s) in PKCS12 format for a specific HTTPS server.
- General Request Header Field : Adds a HTTP request header field (for example “User-Agent”) to the URLs, for all Web servers or for a specific Web server.
- Cookie Modifier : Sets/Extracts/Deletes HTTP cookies.
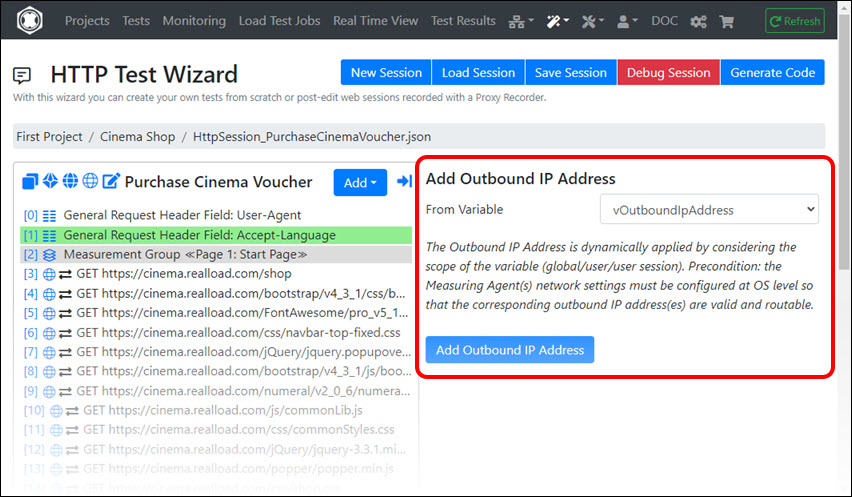
- Outbound IP Address : Supports to use multiple outbound IP addresses on Measuring Agent(s) when executing the test.
- Conditional Jump : Performs a conditional jump (conditional GoTo) to any other session element.
- Plug-In : Executes a “Normal Session Element Plug-In”.
- Input File : Reads an input file line by line, tokenizes each line and extracts the values of the tokens into variables.
- Output File : Stores the values of variables into an output file.
Position of an Added Session Element
If an (existing) session element is selected, the new session element is inserted after it. Or if no session element is selected, the new session element will be added at the end of the session.
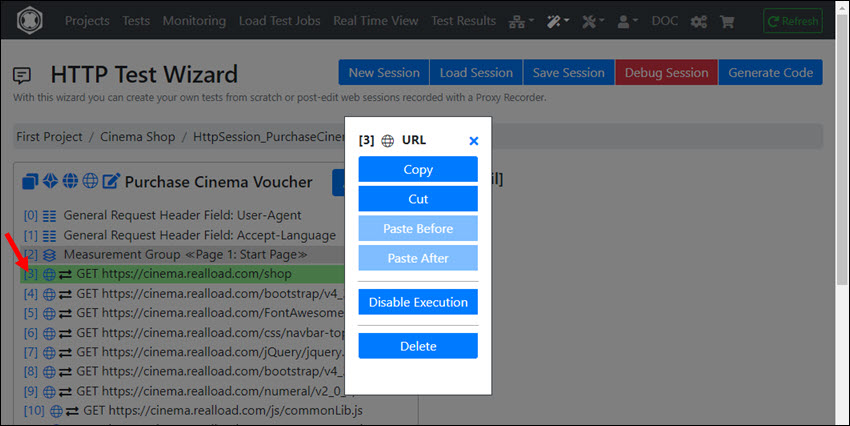
Copy / Cut / Paste and Delete of a Single Session Element
By clicking on the index of a session element, you can copy, cut, paste, and delete it. You can also disable and re-enable the execution of the session element.

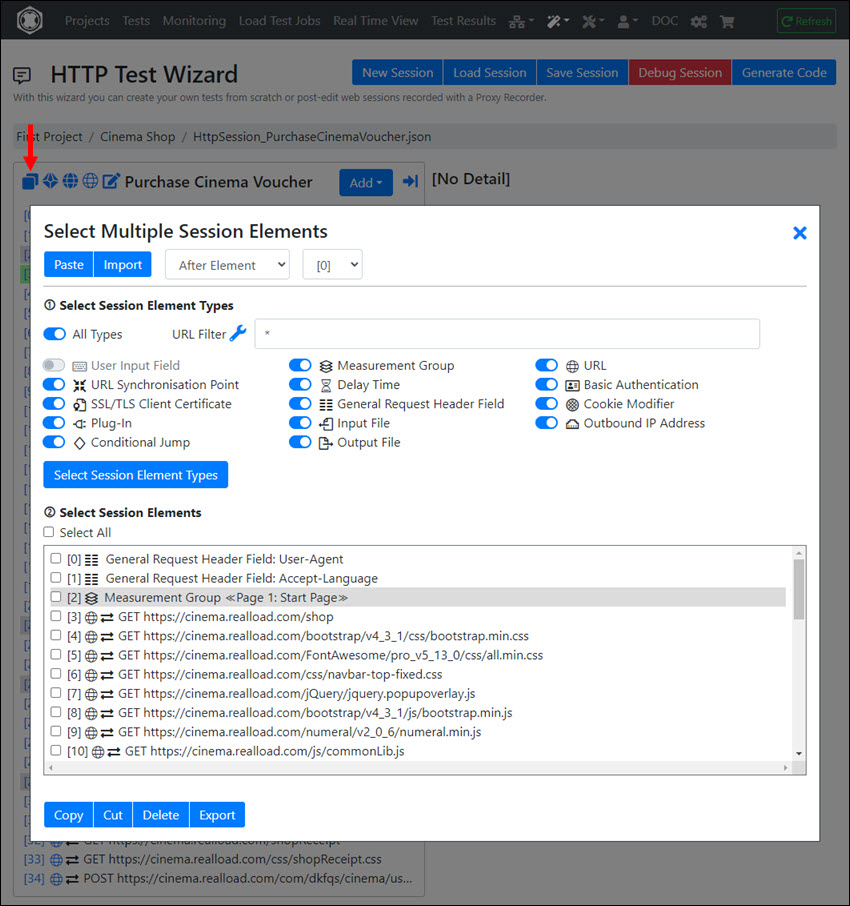
Copy / Cut / Paste and Delete of Multiple Session Elements
By clicking on the ‘Select Multiple Session Elements’ icon, you can copy, cut, paste, and delete multiple session elements:

Displaying and Defining Variables
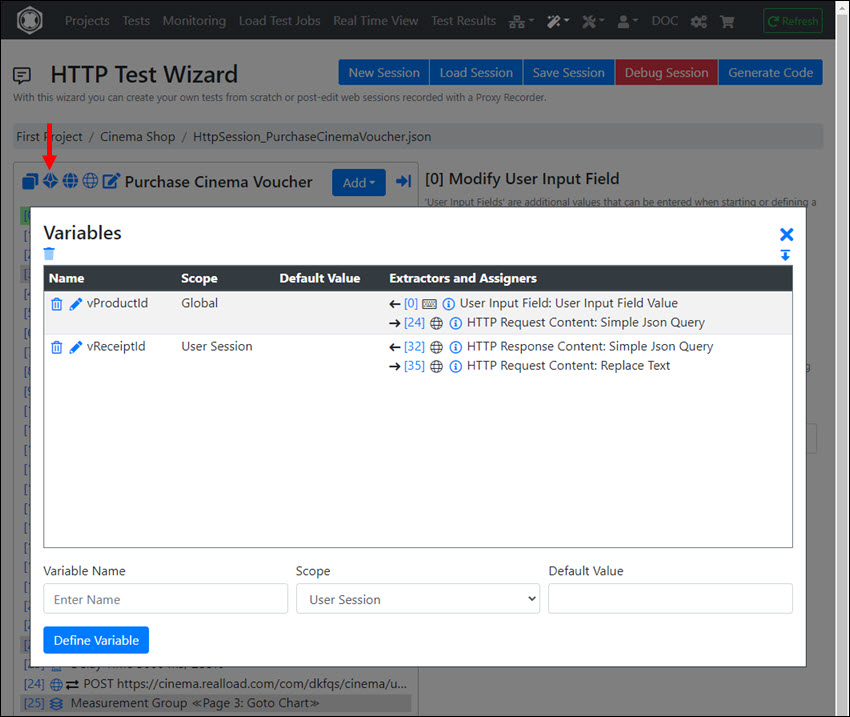
By clicking on the ‘Variables’ icon the list of all variables is shown. Here you can also define new variables and modify their scope and default value.
Furthermore all extractors and assigners for each variable are displayed:

Scopes of Variables
A variable can have the following Scope:
- Global : There is only one instance of this variable during test execution. Such a variable is visible across all simulated users and their session loops. The initial (default) value is assigned at the start of the test.
- User : There are as many (different) instances of this variable as there are users simulated during a test - this means that each simulated user has its own instance. Such a variable is visible across all session loops of the simulated user. The initial (default) value is assigned when the simulated user starts.
- User Session : For each session loop of a user, a new instance of the variable is created, which is only valid and visible during the corresponding session loop. The initial (default) value is assigned at the start of each session loop of a user.
Extractors and Assigners for Variables
- A Variable Extractor defines how the value of a variable is extracted from a session element. The value is typically extracted from an HTTP response of a URL, or from a User Input Field, or from an Input File. Values can also be extracted from many other session elements, such as from HTTP Cookies or from Plug-Ins.
- A Variable Assigner defines how the value of a variable is assigned to a session element. The value is typically assigned to an HTTP request of a URL, but can also be assigned to many other session elements, such as to Plug-Ins or to HTTP Cookies.

See also Handling of Dynamic Session Values.
URL Explorer
With the URL Explorer you can view and search the HTTP data of the URLs, and also post-edit (extract and assign) dynamic session values.


Post-Editing Recorded Sessions
See Handling of Dynamic Session Values.
Post-Editing Manually Entered Sessions
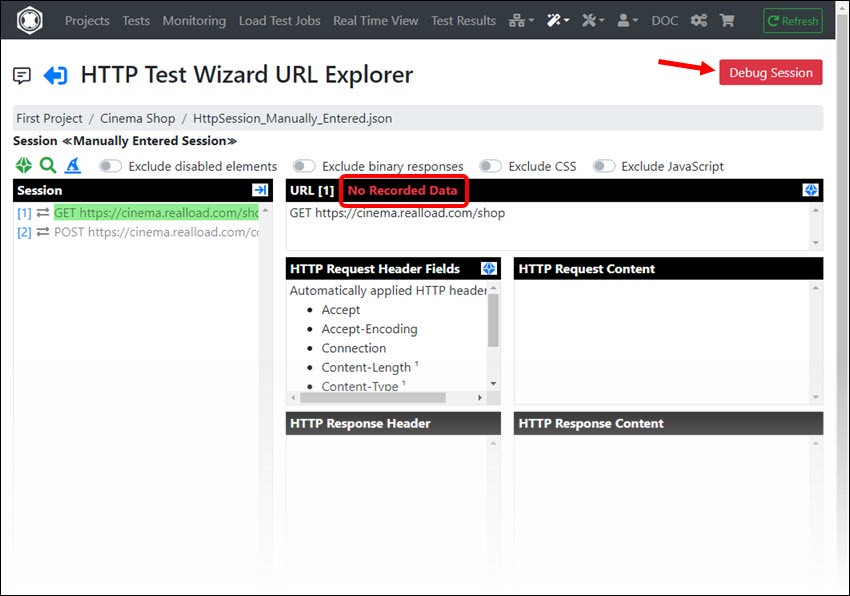
If you entered the session manually (i.e. did not record it with a proxy recorder), the HTTP data for the URLs will be empty because they are currently unknown.
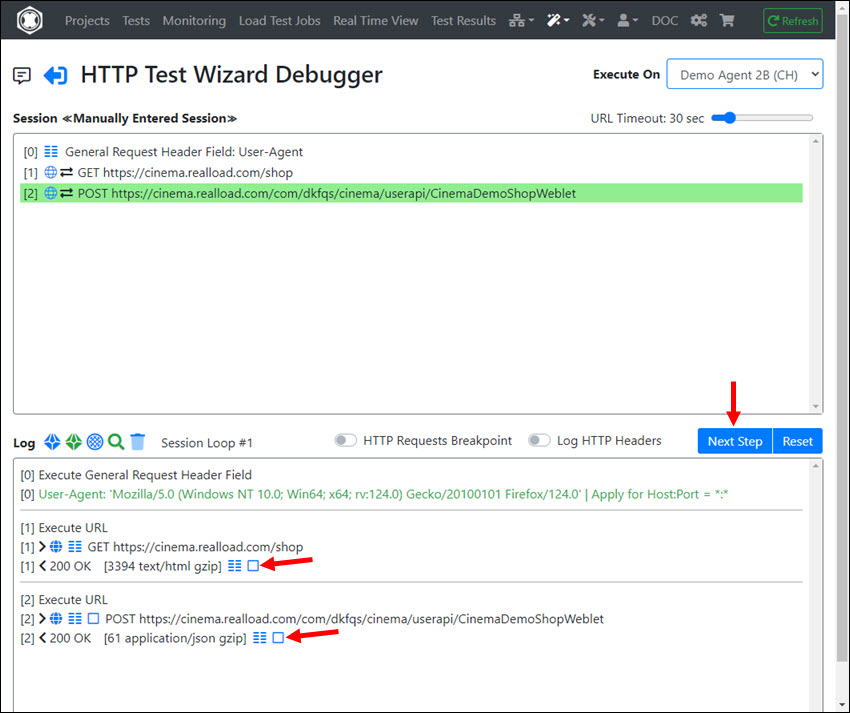
However, you can use the debugger and handle dynamic session values directly in the debugger:

All definitions regarding variables that you make in the debugger are transferred directly to the HTTP Test Wizard session.
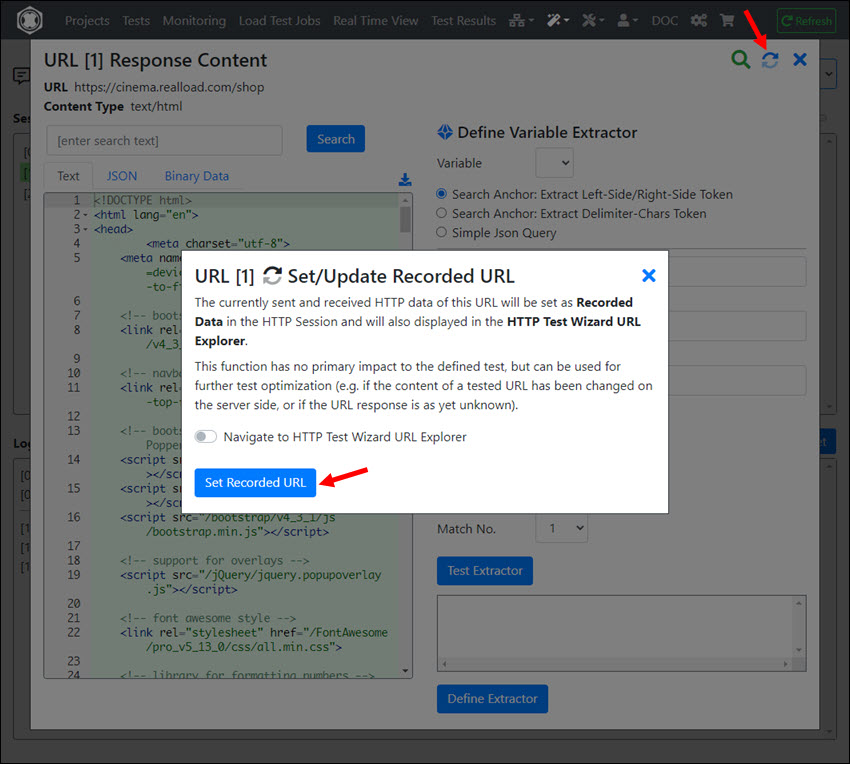
There is another option in the debugger where you can transfer the HTTP data from the URLs into the URL Explorer by clicking on each executed URL at the HTTP response to the ‘Set/Update Recorded URL’ icon:


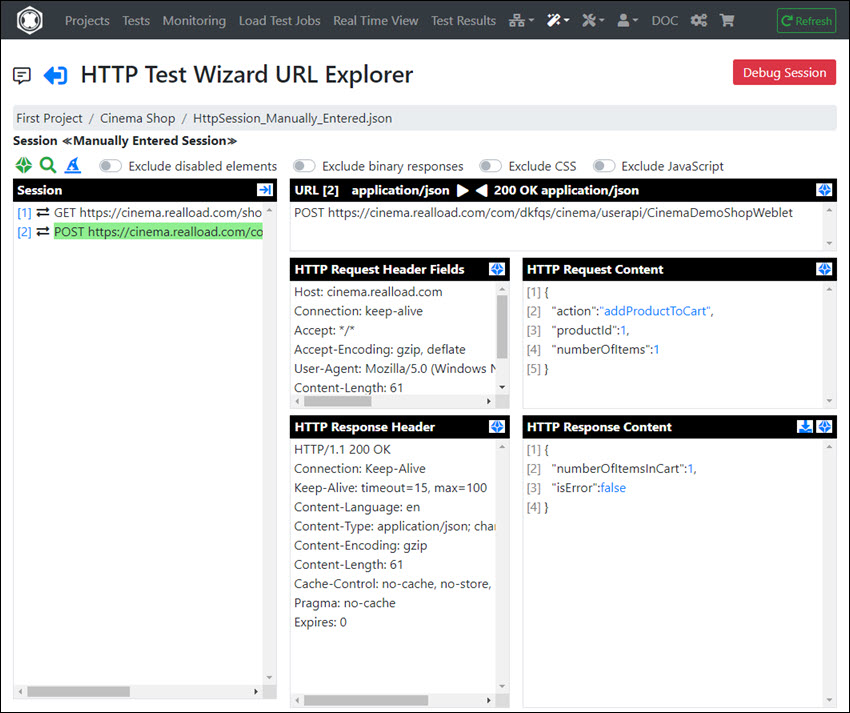
Afterwards it will look something like this in the URL Explorer and you can continue as described at Handling of Dynamic Session Values.

Reviewing and Editing multiple URLs
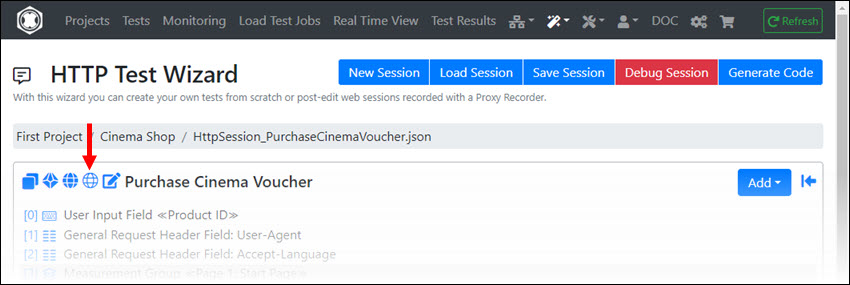
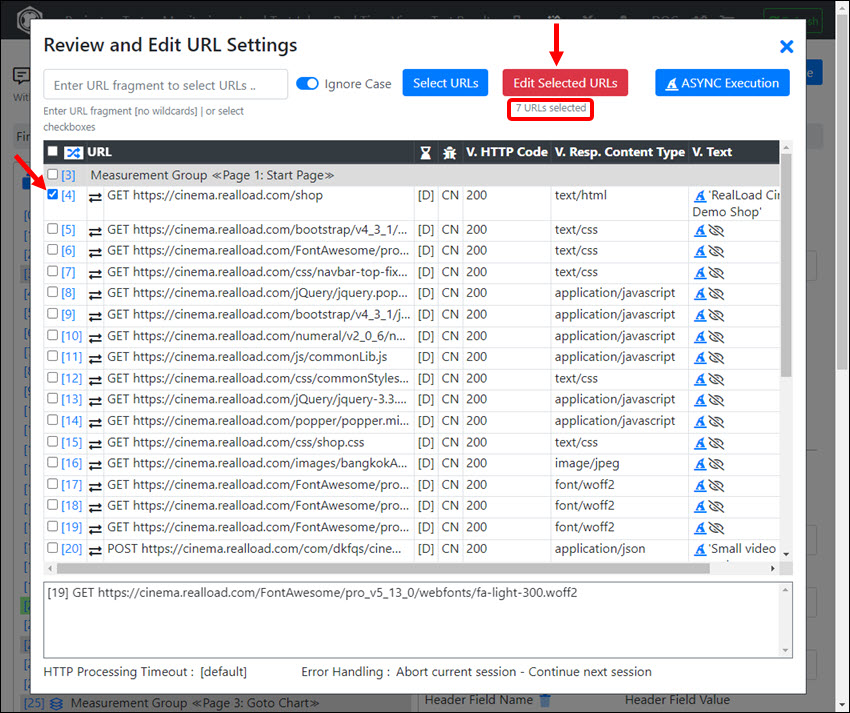
After you’ve finished post-editing the session - and the session is working with the debugger - you should take a look at the content verification of the HTTP responses of all URLs. For example, maybe you forgot to verify the HTTP response status code for some URLs. For this purpose invoke the ‘Review and Edit URL Settings’ wizard:

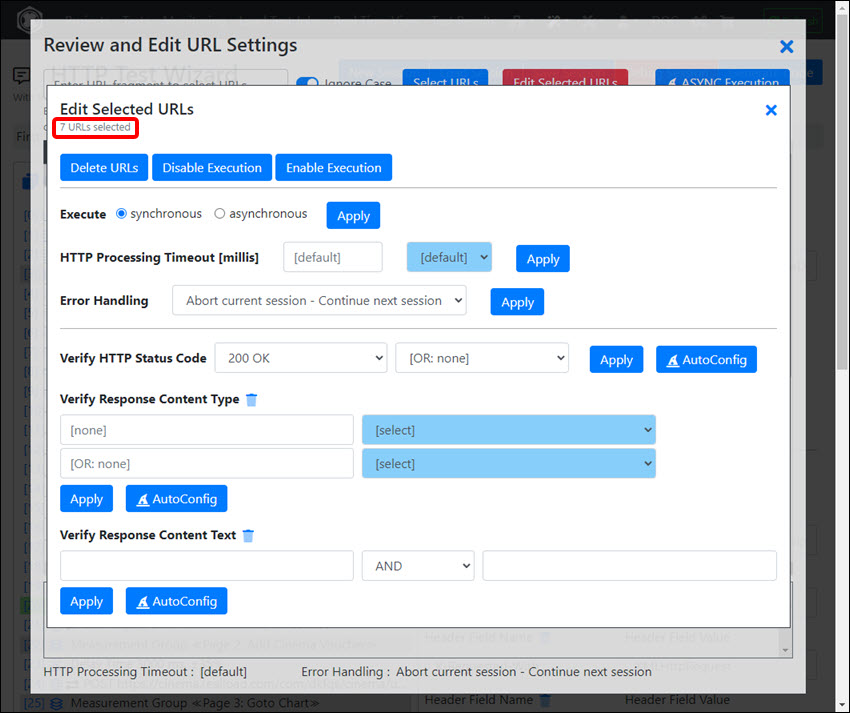
You can also select several URLs here and edit them together:


We also recommend you take a look at Reviewing the HTTP Response Content Validations.
Configuring Parallel URL Execution
A ’normal’ browser loads certain URLs of a website in parallel. For example, images are loaded in parallel.
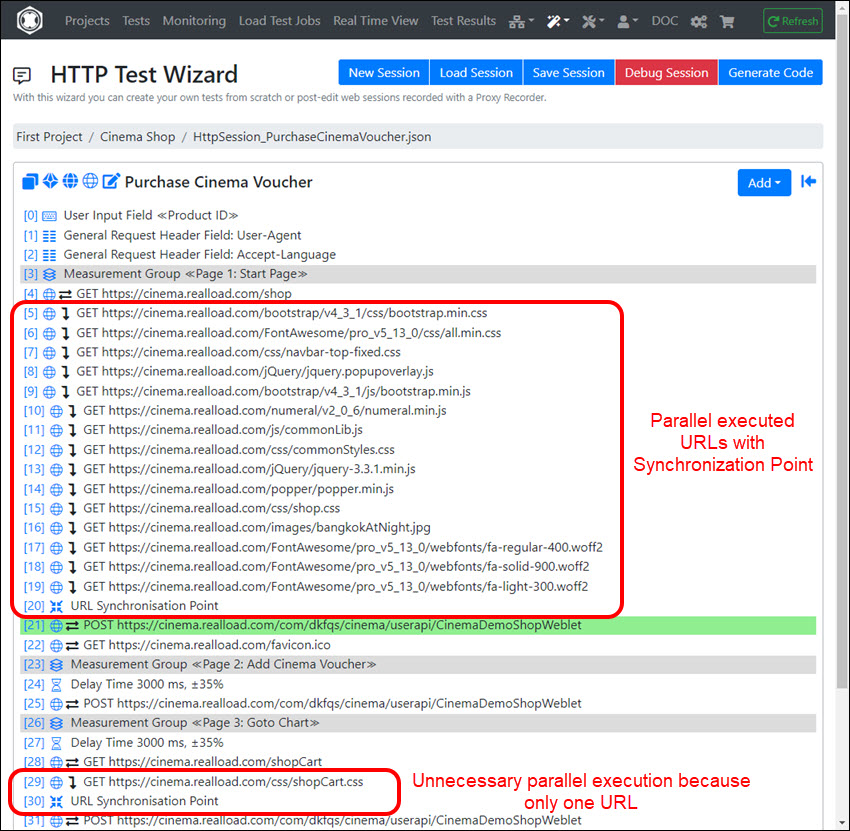
The same behavior can also be achieved in the HTTP Test Wizard by calling the ‘AutoConfig Asynchronous URL Execution’ wizard.
However, please note that this wizard is not perfect - you will probably need to manually adjust the execution of the URLs

After calling the wizard, the execution of the URLs will look like this, for example:

Of course, not all URLs are executed in parallel at the same time. As with a web browser, the HTTP requests are first entered into a queue and then processed by a few working threads (typically 4 threads).
By calling the wizard again you can undo the configuration.
Generating a RealLoad ‘Test’ from an HTTP Test Wizard Session
This is documented at Recording of a Web Surfing Session.
Detailed Doc of Session Elements
“User Input Fields” are additional values that are entered when starting or defining a test execution and that are available as (global) variables during test execution.
A User Input Field contains the following attributes:
- GUI Label : The label of the User Input Field that is displayed in the user interface.
- Variable Name : The name of the global variable at test execution.
- Input Type : The datatype of the input value (String, Integer, Real or Boolean). Please note that the Input Type is only used to validate the input. During test execution, the value of the variable is always converted to a string.
- Default Value : The default value of the variable.
See also Starting a Load Test Job
Measurement Group
Adding Measurement Group(s) is optional and causes the execution time of all subsequent session elements to be displayed in aggregate. The end of a measurement group is defined by either adding another measurement group or reaching the end of the session.
Note: If you Record a Web Surfing Session using a Proxy Recorder, a measurement group is automatically added to the session every time you enter a Page Break.
URL
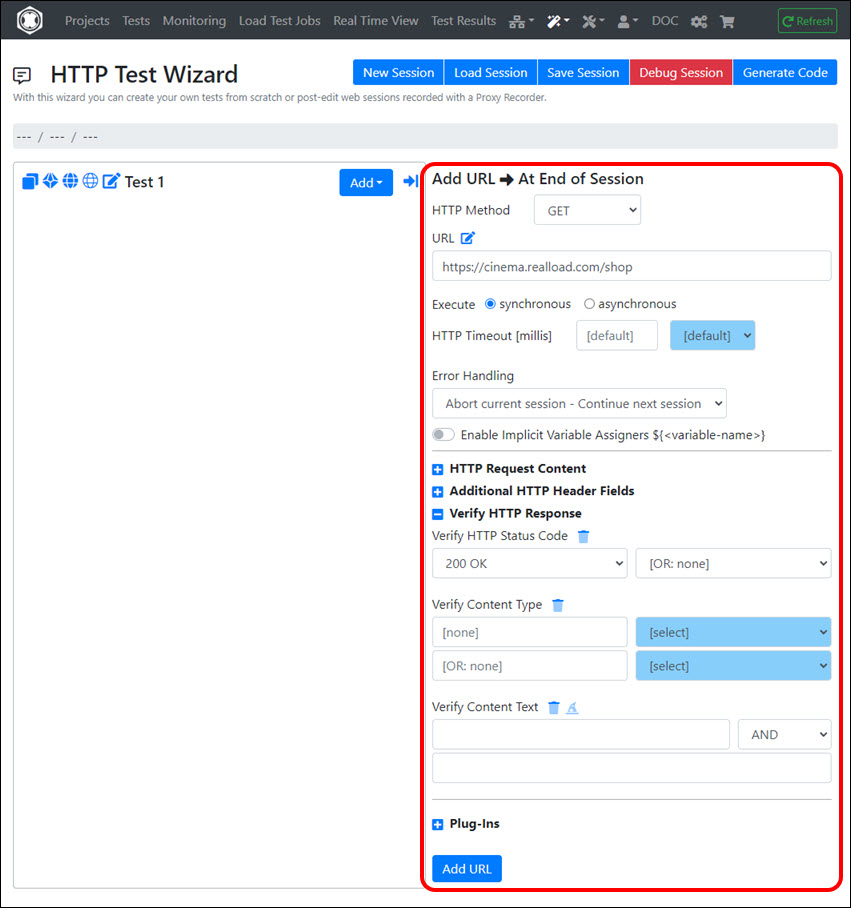
When adding an URL you have at least to select the HTTP Method (for example GET) and to enter the absolute URL (https://<host>/path).
Checking the HTTP response code is optional, but strongly recommended, as otherwise the test result may contain false positive results.

The following fields can be entered or selected:
- General Area
- HTTP Method: Select the HTTP method (GET, POST, …).
- URL: Enter an absolute URL, inclusive (optional) query string parameters. Example: https://www.dkfqa.com/?v=1&w=2
- Execute - synchronous or asynchronous: Determines whether the URL is executed synchronously or in parallel with other URLs (= asynchronous). If you choose “asynchronous” then you have also to add an URL Synchronisation Point to the test sequence after the asynchronous executed URLs.
- Error Handling: Select what happens if the HTTP request fails or if the HTTP response is invalid. “Final End” means that the whole test is aborted.
- Enable Implicit Assigners ${<variable-name>}: If checked, then placeholders for variables are considered in the URL as well as in the HTTP request header and content. Example: URL = https://${vHost}/?v=1&w=2, Variable vHost = “www.realload.com”, Result = https://www.realload.com/?v=1&w=2 . Note: instead of using implicit Assigners you can also define Variable Assigners.
- HTTP Request Content Area | Only fill in this area if the HTTP request contains a content, for example for POST requests.
- Request Content Type: Select or enter the request content type. For example “application/x-www-form-urlencoded” or “application/json”.
- Request Content Charset: Select or enter the request content charset - or let the field blank if not applicable.
- Direct Value or Read From File: Select if the request content data are directly entered here or are read from a file.
- Request Content Data: Enter the request content data (if they are not read from a file). Note: select first the Request Content Type before you enter the Request Content Data.
- Also send Zero Content Length: If checked, but no content is available, the HTTP request header field “Content-Length: 0” is sent.
- Additional HTTP Header Fields Area
- You can enter additional HTTP request header fields here which are only applied for this URL. Note: additional HTTP request header fields that apply to all URLs should instead be defined by using a General Request Header Field session element.
- Verify HTTP Response Area | Note: you should configure at least a HTTP response code in order to verify the test result.
- Verify HTTP Status Code: Select the expected HTTP response code(s).
- Verify Content Type: Select the expected HTTP response content type(s).
- Verify Content Text: Enter text fragments that must be present in the HTTP response content, or let the fields blank if not applicable.
- Plug-Ins Area
URL Synchronisation Point
If you have manually added URLs and configured them to run in parallel (asynchronous) with other URLs, you must add a URL Synchronisation Point after the end of all URLs running in parallel.
See also Configuring Parallel URL Execution
Delay Time
This session element delays execution for a certain time.
The following fields can be entered or selected:
- Title : The title or description (optional).
- Delay Time : The delay time in milliseconds.
- Random Deviation : The random deviation in percent of the Delay Time. Example: if the delay time is 4000 ms and the random deviation is 50% then the randomized delay time that is applied is between 2000 ms and 6000 ms.
Basic Authentication
This session element adds a Authorization: Basic <credentials> HTTP request header field to the HTTP requests of the URLs.
The following fields can be entered or selected:
- Apply for Host : The DNS hostname or the IP Address of the Web Server to which the authentication is sent, or ‘*’ = all Web Servers.
- Apply for Port : The TCP port of the Web Server to which the authentication is sent, or ‘*’ = all Web Servers.
- HTTPS only : If checked, basic authentication will only be sent over encrypted HTTPS connections.
- Direct Value : If checked, the Username and Password can be entered directly. The same value is applied for all simulated users.
- Read Values from Input File : If checked, the Usernames and Passwords are read from an (already defined) Input File. The Scope of the Input File determines how the usernames and passwords are assigned to the simulated users.
- Username : The username (direct value).
- Password : The password (direct value).
- Input File : Select an Input File session element here (if ‘Read Values from Input File’ is checked).
- Username Token No. : Select the token number of the Input File from which the Username is extracted.
- Password Token No. : Select the token number of the Input File from which the Password is extracted.
SSL/TLS Client Certificate
Using this session element, one or multiple SSL/TLS Client Certificates can be configured, which are used for HTTPS server authorization.
The following fields can be entered or selected:
- Apply for Host : The DNS hostname or the IP Address of the HTTPS server.
- Apply for Port : The TCP port of the HTTPS server.
- Single Certificate : If checked, the PKCS12 File can be selected and the Password of the Certificate can be entered directly. The same certificate is applied for all simulated users.
- Multiple Certificates referenced by Input File : If checked, the File Names of the PKCS12 Files and the corresponding Passwords of the Certificates are read from an (already defined) Input File. Note that the PKCS12 Files must be located in the same Project/Resource Set where the Input File is located. The Scope of the Input File determines how certificates are assigned to the simulated users.
- Certificate Password : The password of the certificate (if ‘Single Certificate’ is checked).
- Input File : Select an Input File session element here (if ‘Multiple Certificates referenced by Input File’ is checked).
- PKCS12 File Token No. : Select the token number of the Input File from which the PKCS12 File Name is extracted.
- Certificate Password Token No. : Select the token number of the Input File from which the Password of the Certificate is extracted.
This session element adds a HTTP request header field to the HTTP requests of the URLs.
The following fields can be entered or selected:
- Header Field Name : The name of the HTTP request header field. Example: ‘User-Agent’
- Apply for Host : The DNS hostname or the IP Address of the Web Server to which the HTTP request header field is sent, or ‘*’ = all Web Servers.
- Apply for Port : The TCP port of the Web Server to which the HTTP request header field is sent, or ‘*’ = all Web Servers.
- Direct Value : If checked, the value of the HTTP request header field can be entered directly. The same value is applied for all simulated users.
- Assign Value from Variable : If checked, the value of the HTTP request header field is assigned by a Variable. The Scope of the Variable determines how the value of the HTTP Request Header Field is assigned to the simulated users.
- Direct Value : The value of the HTTP Request Header Field (if ‘Direct Value’ is checked).
- Variable : Select a Variable here (if ‘Assign Value from Variable’ is checked).
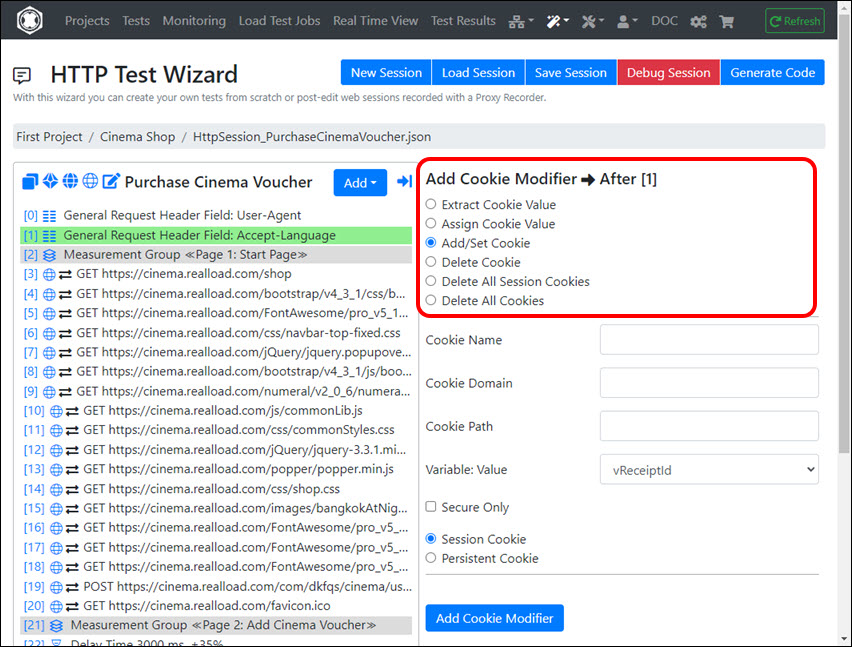
Cookie Modifier
Using this session element, HTTP Cookies can be manipulated - regardless of whether they are “HttpOnly cookies” or not.

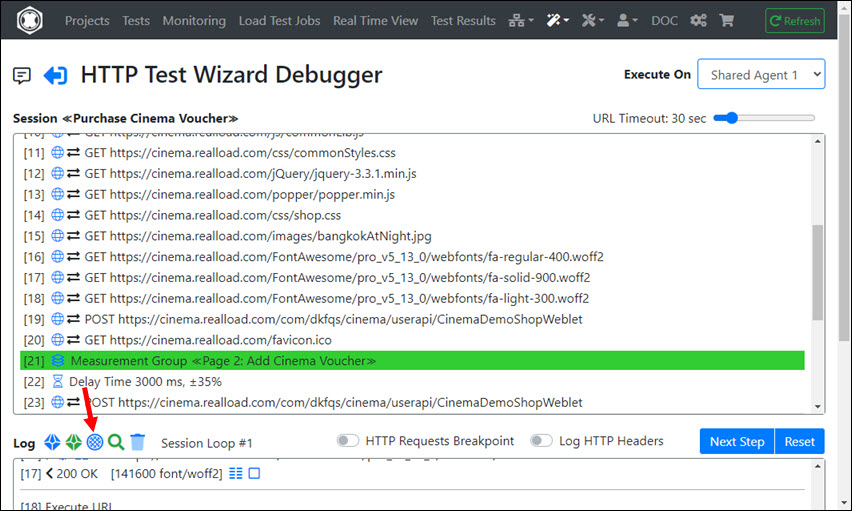
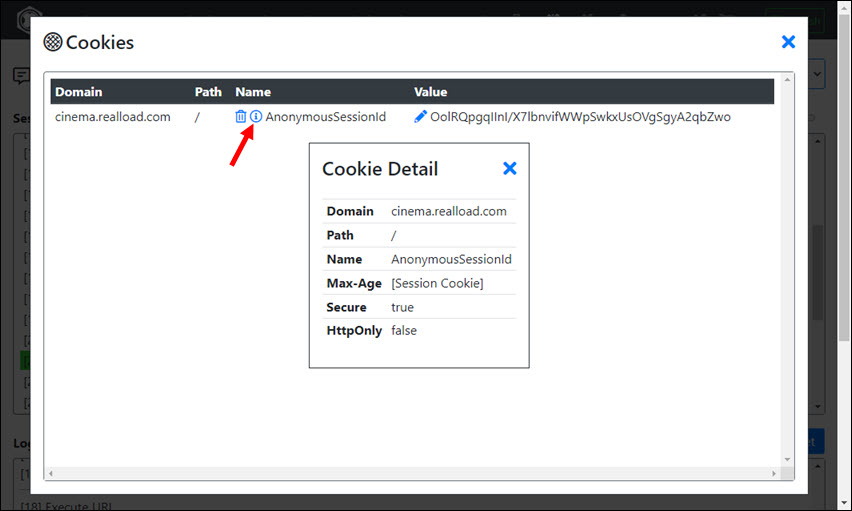
Tip: You can use the Debugger to examine the cookies.


Extracts the value of a cookie into a variable. The following fields can be entered or selected:
- From Cookie Name : The name of the cookie.
- Cookie Domain : The domain of the cookie.
- Cookie Path : The path of the cookie.
- To Variable : Select a Variable here to which the value of the cookie is assigned.
Assign Cookie Value
Assigns the value of a variable to the value of a cookie. The following fields can be entered or selected:
- From Variable : Select a Variable here whose value is assigned to the cookie.
- To Cookie Name : The name of the cookie.
- Cookie Domain : The domain of the cookie.
- Cookie Path : The path of the cookie.
Add/Set Cookie
Adds or overwrites a cookie. The following fields can be entered or selected:
- Cookie Name : The name of the cookie.
- Cookie Domain : The domain of the cookie.
- Cookie Path : The path of the cookie.
- Variable: Value : Select a Variable here whose value is assigned to the cookie value.
- Secure Only : If checked, the cookie will only be sent over encrypted HTTPS connections.
- Session Cookie : If checked, the cookie is only valid in the session loop of the simulated users (all session cookies will be cleared before each iteration of a session loop).
- Persistent Cookie : If checked, the cookie is a permanent cookie.
Delete Cookie
Deletes a cookie. The following fields can be entered or selected:
- Delete Cookie Name : The name of the cookie.
- Cookie Domain : The domain of the cookie.
- Cookie Path : The path of the cookie.
Delete All Session Cookies
Deletes all session cookies.
Delete All Cookies
Deletes all cookies.
Outbound IP Address
The dynamic assignment of multiple outbound IP addresses for the executed URLs of the simulated users is only possible if you operate specially configured Measuring Agents yourself - or have them operated by us.
Basically, every internet device only has a single routable IP address. However, each operating system can be reconfigured so that it supports multiple IP addresses - if the network environment allows it and the additional IP addresses are also routable.
You can only use this session element if you have access to such specially configured Measuring Agents.
The Outbound IP Addresses are set by a Variable (often extracted from an Input File), where the Scope of the Variable determines how the Outbound IP Addresses are assigned to the simulated users.

Conditional Jump
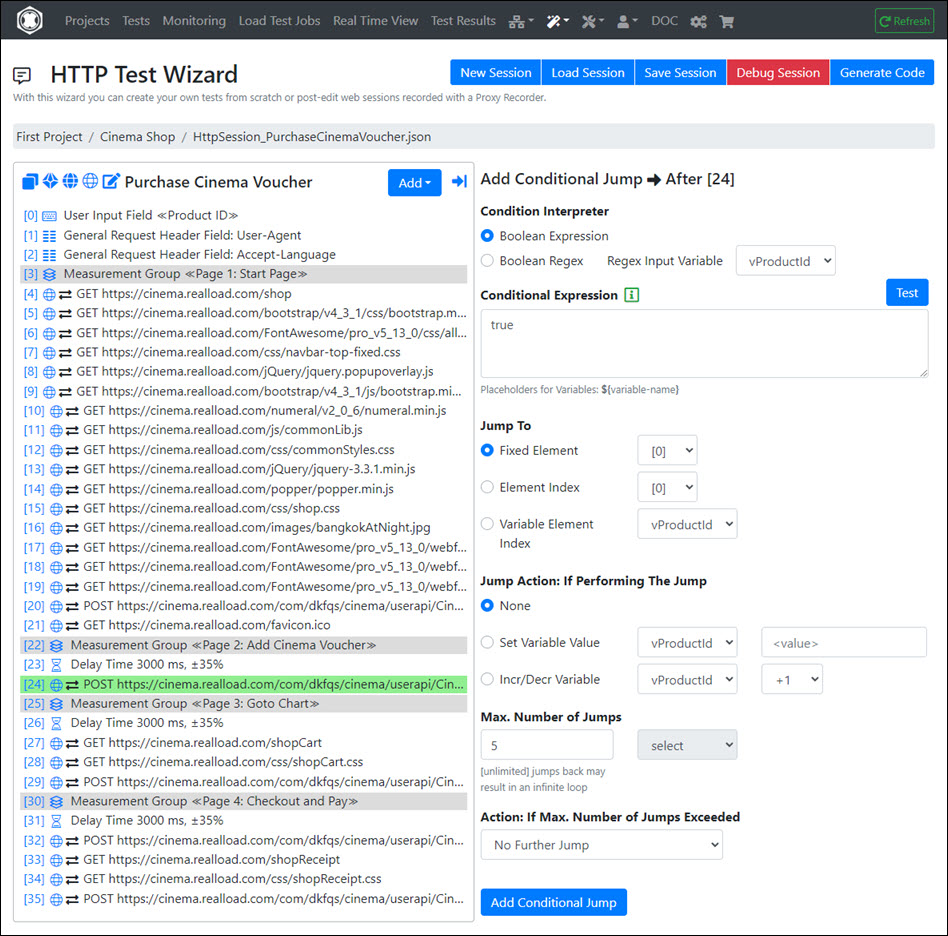
This session element performs a conditional jump (conditional GoTo) to any other session element, based on a fixed value or on the value of one or several variables. The number of jumps is counted and can also control the conditional execution.
Background Information on the Technical Concept
Conditional jumps are powerful elements for jumping back and forth in a session, and also contain an internal counter that counts how many jumps have been made. Using this internal counter, inner session loops can also be implemented - but in a much more flexible way as traditional ‘for’ or ‘while’ loops.

Conditional Jumps are based on a Conditional Expression whose result is always true or false. If the condition is true, the test execution of the currently executed user session jumps to the addressed (target) session element.
Two types of Condition Interpreters are supported:
- Boolean Expression, such as 1 <= 2
- Boolean Regex, such as (.)Zurich(.)
One or multiple Placeholder for Variables in the format ${variable-name} can be used at any point in a Conditional Expression:
- Example of Boolean Expression with a placeholder variable: ${X} <= 2
- Example of Boolean Regex with a placeholder variable: (.)${Y}(.)
Functionality of the Boolean Expression Interpreter
The Boolean Expression Interpreter supports:
- The simple keywords true and false (without further text) which effects that the interpreter always returns true or false.
- Simple conditional expressions, such as 10 > 9 | Note: simple expressions are not enfolded by brackets.
- Boolean expressions with two conditional expressions, such as (5 > 6) || (6 > 5)
- Multiple boolean expression, such as ((5 > 6) or (6 > 5)) and ("Meier" contains "ei")
Supported comparison operators:
- <
- <=
- ==
- >=
- >
- !=
- contains
- !contains
Supported boolean operators:
- && or alternatively the keyword and
- || or alternatively the keyword or
Parsing of values:
- First the interpreter tries to convert values into numbers. If this succeeds for both values of a conditional expression, the comparison is performed with the numbers.
- If one of the values cannot be converted into a number, both values are interpreted as text and compared as text.
- Simple text values cannot contain spaces. However, it is supported for text values to be enclosed in double quotes, which circumvents this restriction.
-
Text values enclosed in double quotes are not converted to a number.
Functionality of the Boolean Regex Interpreter
The Boolean Regex Interpreter requires two arguments:
- The input to which the Regex is applied. This is always referenced by a variable whose value is interpreted as Regex input.
- The Boolean Regex itself which can contain placeholder for variables. The values of the placeholder variables are replaced first, before the Boolean Regex is evaluated.
Jump To : Target Session Element
A target session element can be:
- A fixed session element : That means that the jump is always made to this session element, regardless of whether new session elements are added or existing session elements are deleted.
- A Session element addressed by element index : That means that the jump is performed to the index of a session element. In case if session elements are added or deleted, the jump target may change - you may need to reconfigure the conditional jump settings in such a case.
- A Session element addressed by a variable whose value is interpreted as (integer number) element index. This allows dynamic jumps.
Jump Action
The jump action is performed when the jump is executed (if Conditional Expression == true):
- None (no specific action)
- Set Variable Value : When jumping, the variable is set to this value.
- Incr/Decr Variable : When jumping, the value of the variable is interpreted as (long) integer number and incremented or decremented by the configured amount.
Max. Number of Jumps
This is the limit of the maximum executed jumps per user session (per session loop) - applied to this conditional jump.
For jumps back to previous session elements, this limit should never be ‘unlimited’, otherwise this can end in an endless loop.
After this limit has been reached, the Action: If Max. Number of Jumps Exceeded rules what happens next.
Action: If Max. Number of Jumps Exceeded
One of the following actions can be configured if the limit of ‘Max. Number of Jumps’ is exceeded for this conditional jump:
- No Further Jump : Recommended for simple inner loops.
- Abort User Session and Report Error : The simulated user aborts the current session and will continue with the next session (if the maximum number of outer session-loops per user is not reached).
- Abort User and Report Error : The simulated user is terminated - but all other simulated users continue to run.
- Abort Test and Report Error : All simulated users will be stopped and the test execution will be aborted prematurely.
Plug-In
See Plug-Ins.
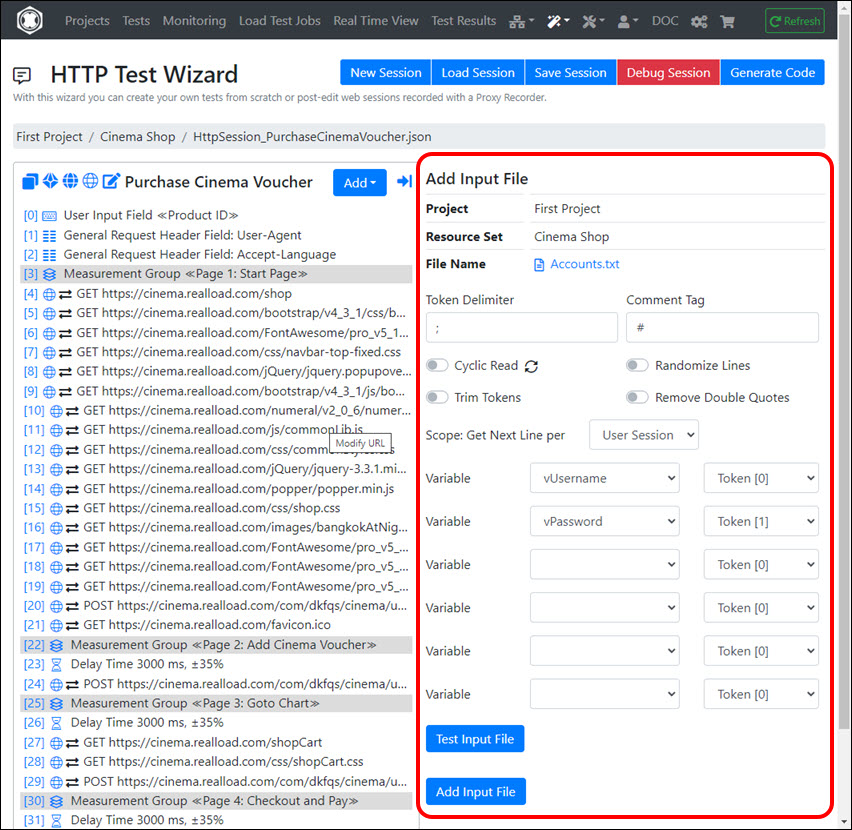
Input files are text files (*.txt, *.csv) whose content is read line by line during the test. Each line is divided into tokens from which values of variables are extracted.
Empty lines are skipped. Note that the variables whose values will be extracted from the input file must first be defined before you can add an input file.
The following fields can be entered or selected:
- Token Delimiter: The token delimiter. This is usually a single character, but can be also a string.
- Comment Tag: Lines which are starting with the comment tag are skipped. You can place also the comment tag within a line which means that the remaining part of the line is ignored. The comment tag is usually a single character, but can be also a string.
- Cyclic Read: If not checked, then the test will end when no further line can be read (at eof). On the other hand, if checked, the file is re-read after the end of file was reached.
- Randomize Lines: if checked then the order of the lines is randomized each time when the file is read.
- Trim Values: If checked then whitespace characters are removed from the start and end of the extracted values (tokens).
- Remove Double Quotes: If checked then double quotes are removed from the extracted values (tokens).
- Scope: Get Next Line per:
- Global: Reads only a single one line of the file. The line is read at the start of the test.
- User: Reads each time a line from the file when a simulated user is started.
- User Session: Reads each time a line from the file when a simulated user starts a new session loop iteration.
- 6x Variable - Token[Index]: You can configure up to 6 token indexes whose values are extracted into variables.

Output File
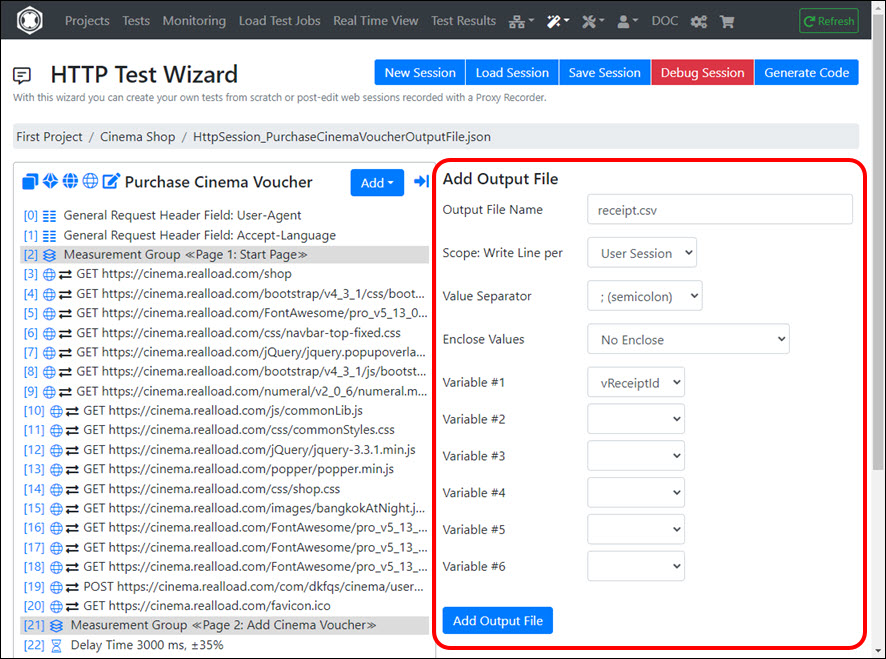
Output files are text files (*.txt, *.csv) into which values of variables are written. The file is saved in the output directory of the test job.
The following fields can be entered or selected:
- Output File Name: The name of the output file.
- Scope: Write Line per:
- Global: Only a single line is written to the file at the end of the test.
- User: Each time a simulated user’s execution ends, a line is written to the file.
- User Session: At the end of each execution of a session loop of any simulated user, a line is written to the file. If the session loop is aborted (for example because an error was measured), no line is written.
- Value Separator: The separator between the values.
- Enclose Values: Here you can configure how the values are enclosed.
- 6x Variable: Up to 6 Variables can be selected
Application Example
You can use Output Files with the Scope ‘User Session’ to filter out invalid accounts from a list of accounts (from an Input File), since invalid accounts do not reach the end of the session loop - and no new line is then added for them to the output file. This means that the output file only contains valid accounts.


Plug-Ins
Plug-Ins are reusable HTTP Test Wizard extensions that are manually programmed. They can also be published by manufacturing users and imported by other users.
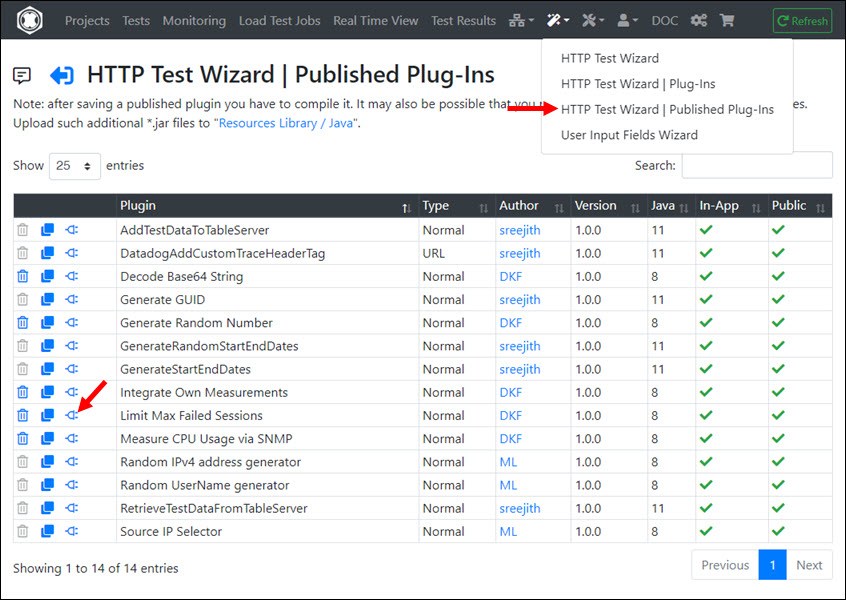
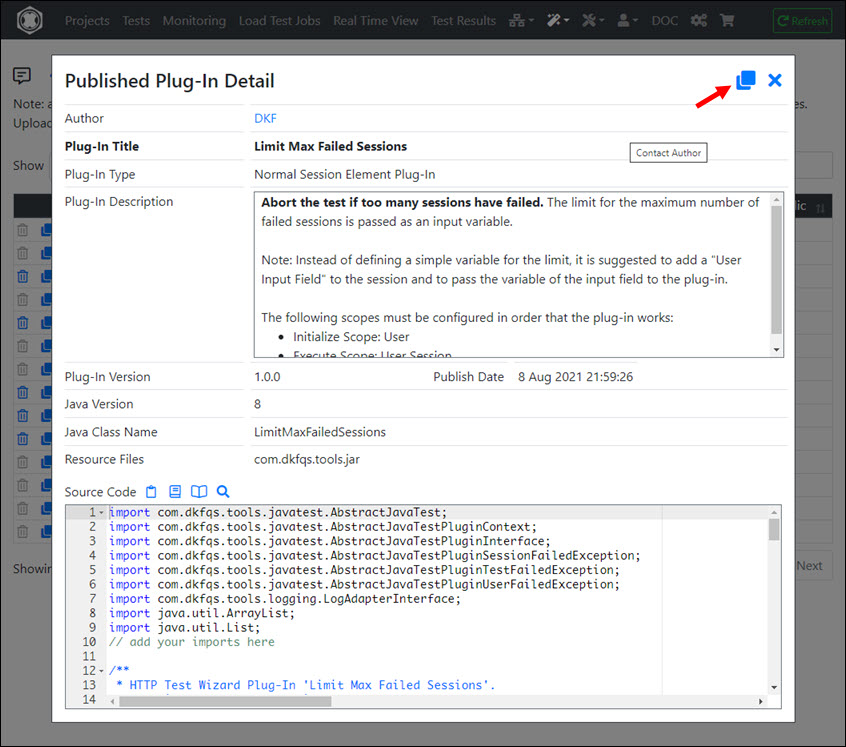
Therefore, before you start programming your own plug-in, take first a look at the already published plug-ins.
Note
In order to extract and assign variable values from and to URLs, no plug-ins are normally required, since a large number of algorithms are available. The use of plug-ins only makes sense if there are special requirements that go beyond the standard functionality of the HTTP Test Wizard.
Plug-In Types
There are 3 types of plug-ins:
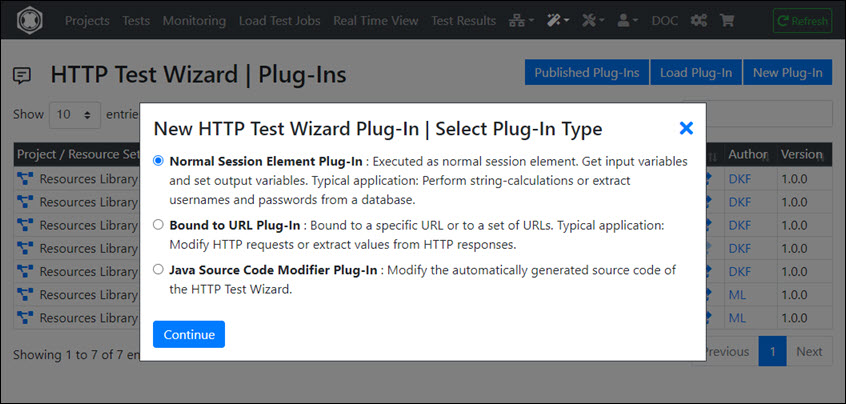
- Normal Session Element Plug-Ins: As the name suggests, such plug-ins are executed as a normal session element. This type of plug-in is versatile and can, among other things, process variables, abort the current session, the user or the entire test, or even perform independent measurements with any protocol.
- Bound to URL Plug-Ins: Such plug-ins are linked to a URL session element and can change the HTTP request before sending it to the server and post-process the received HTTP response - such as extracting variable values or checking the content of the HTTP response. Such plug-ins can also abort the current session, the user, or the entire test.
- Java Source Code Modifier Plug-Ins: These are special plug-ins that can subsequently modify the source code generated by the HTTP Test Wizard. Usually such plug-ins are only used as a workaround if the HTTP Test Wizard generates faulty or incomplete source code.
Importing Published Plug-Ins


Note
For copyright and security reasons, the published plug-ins only contain the source code, but not the compiled code and no third-party JAR libraries that may be required.
If third-party JAR libraries are required, the “Plug-in Description” provides instructions on how to download these libraries. Third-party JAR libraries should always be saved in the project/resouce set “Resources Library/Java”.
After you have imported the plug-in you have to load and compile it - then save the compiled plug-in.


After you have saved the compiled plug-in you can add it to your HTTP Test Wizard session. Plug-ins of the type “Java Source Code Modifier Plug-Ins” do not have to be added, but can be called directly after the source code of the test program has been generated.
How do I get Support from the Plug-In Manufacturer?
In order to get support from the plug-in manufacturer, you have to enable in your Profile Settings the option “Public In-App User”. Then you can communicate with the plug-in manufacturer via “In-App Messages”.

Developing own Plug-ins
Own plug-ins can be developed in Java 8 or 11.
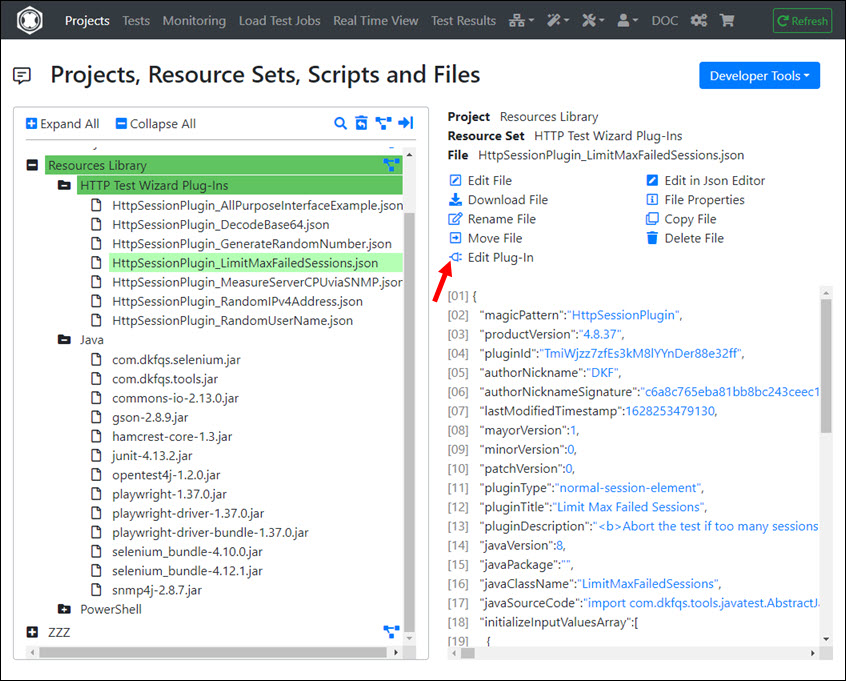
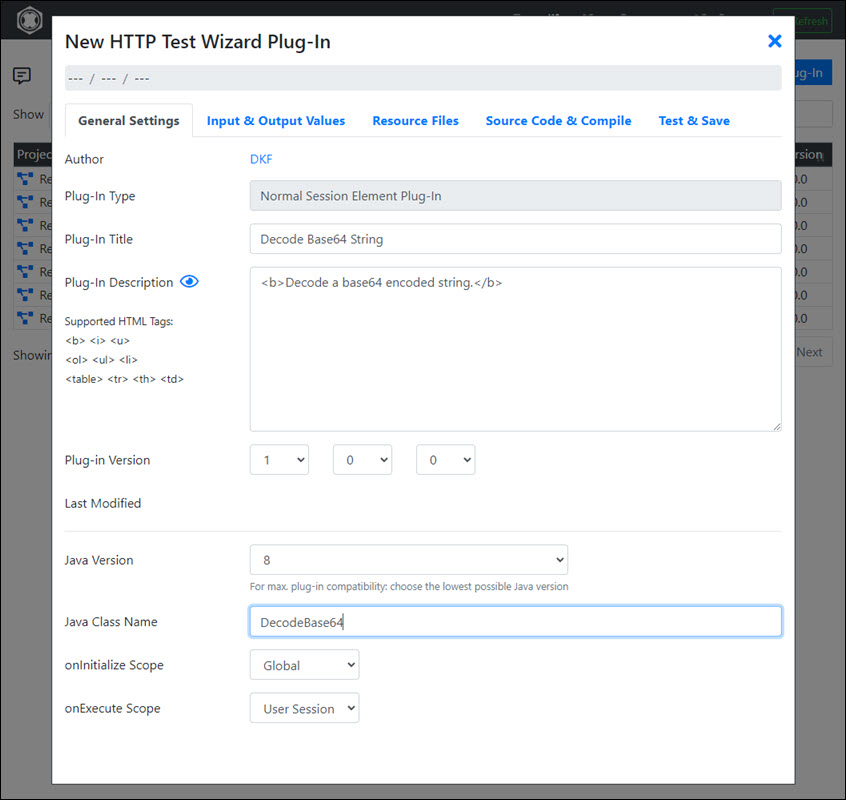
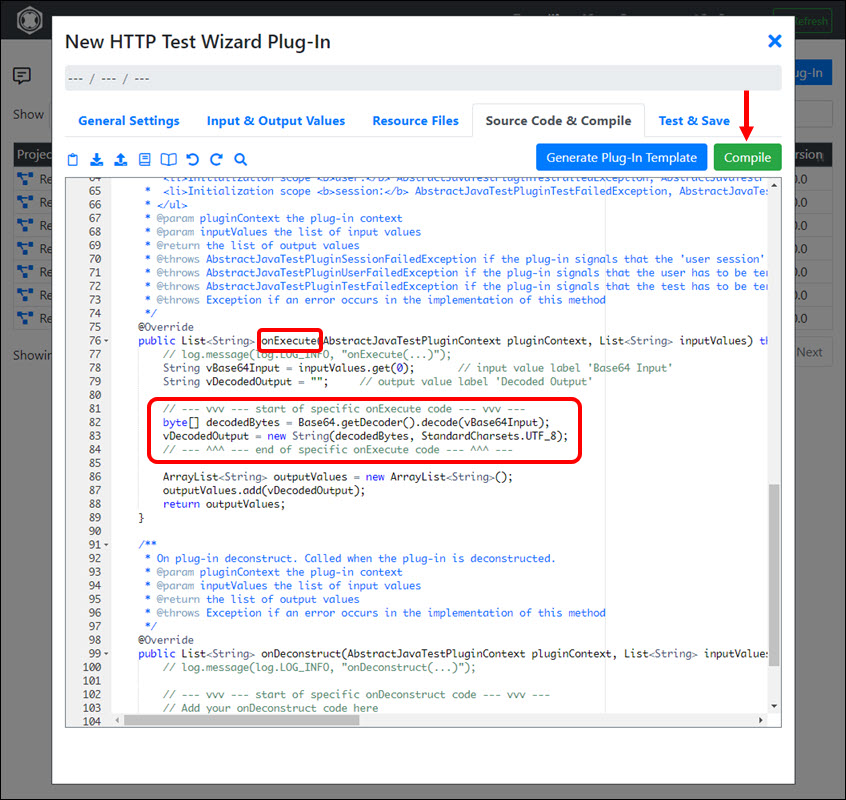
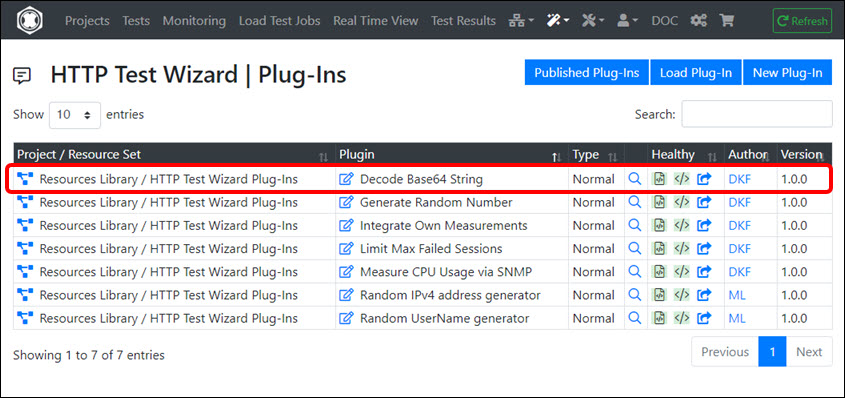
The following example shows a plug-in which decode a base64 encoded string.


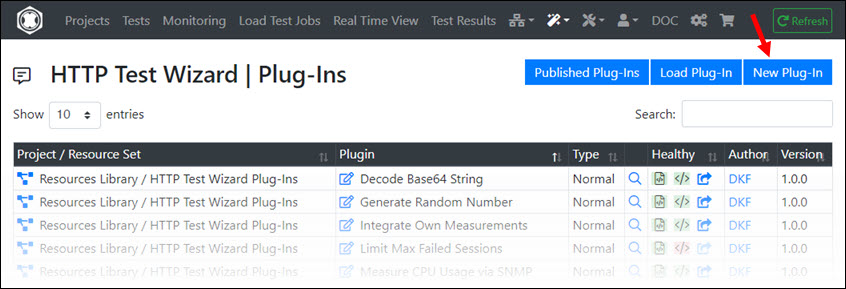
After clicking at “New Plug-In” the plugin type has to be selected (in this example “Normal Session Element Plug-In”):

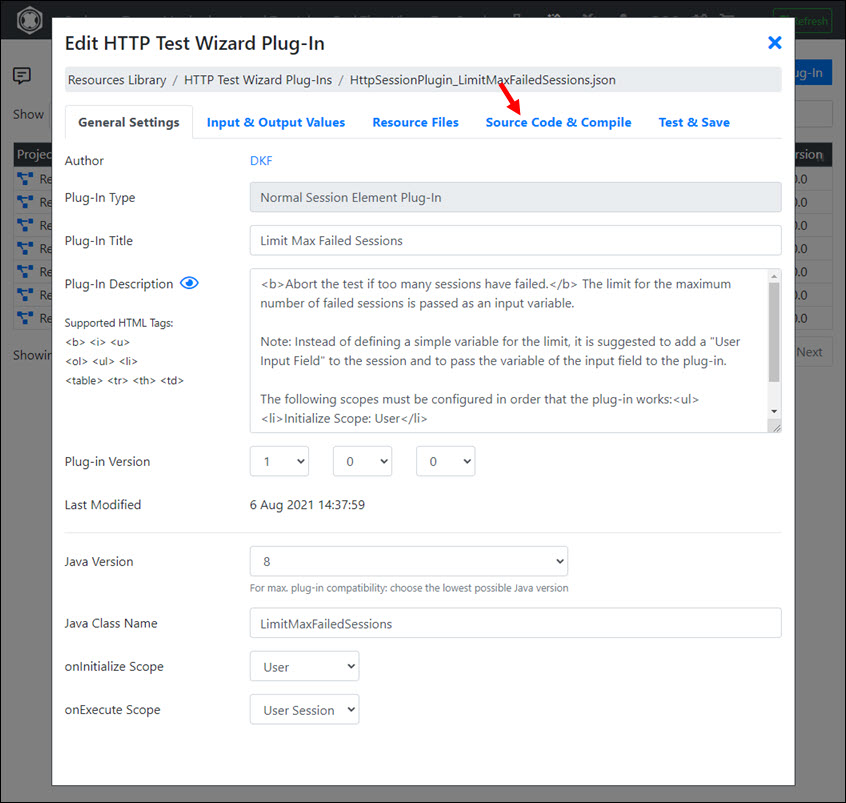
At the “General Settings” tab you have at least to enter the Plug-In Title and the Java Class Name. You should als enter a Plug-In Description which can be formatted by simple HTML tags. The onInitialize Scope can be set to “Global”, as this plug-in does not require any initialization. The onExecute Scope is set to “User Session” in order that all kind of variable scopes are supported.

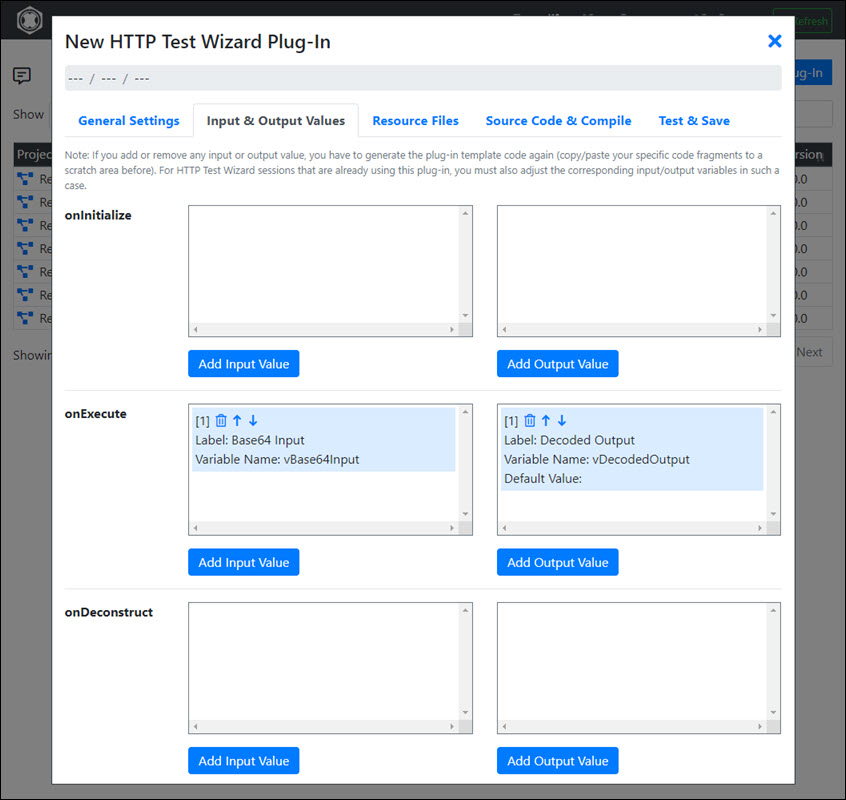
At the next tab - “Input & Output Values” - a plug-in input and a plug-in output (Java-)variable is defined for the plug-in method onExecute. The values of this two Java variables will later correspond with two HTTP Test Wizard variables (which may have a different variable name):

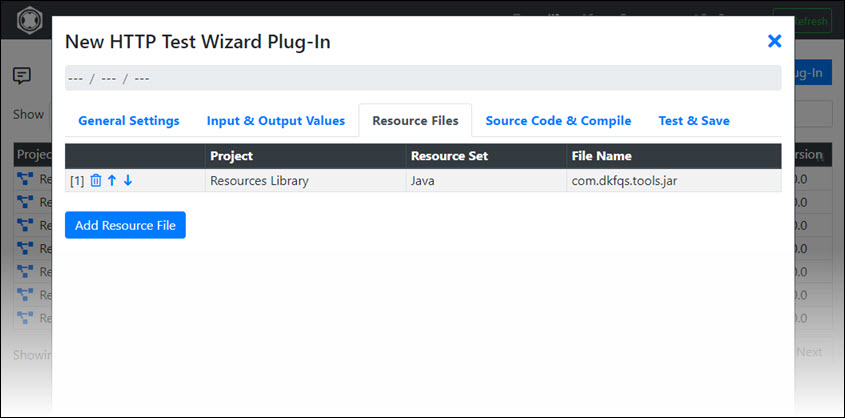
When you click at the next tab - “Resources Files” - you will see that the Java library com.dkfqs.tools.jar is already added to the plugin. This is normal as all kind of plug-ins require this library. Here you may add also other Java libraries required by the plug-in - but in this case no other libraries are needed.

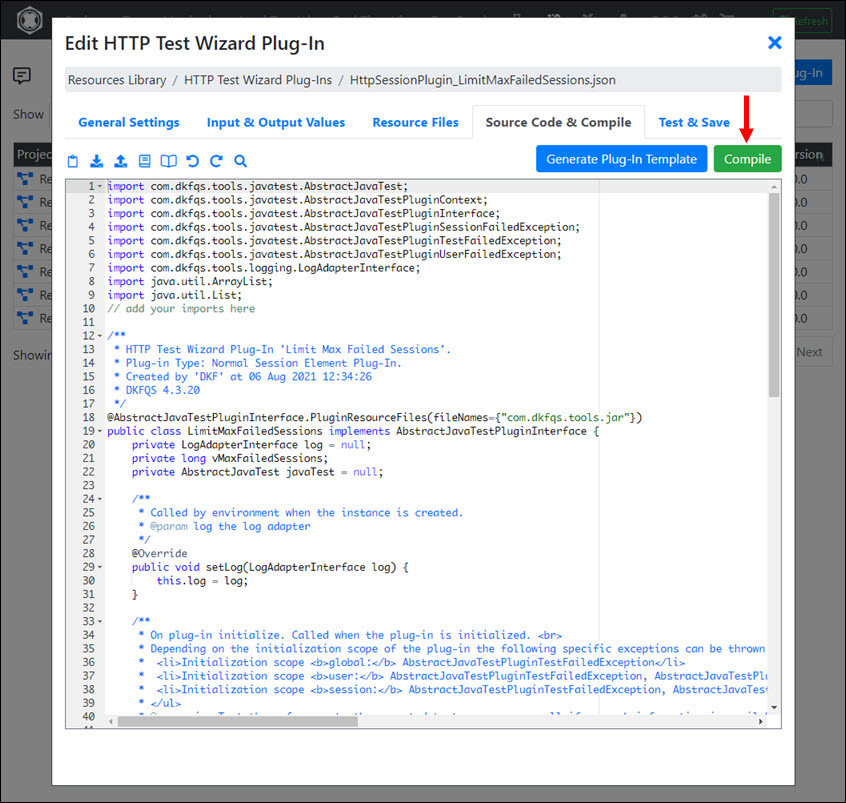
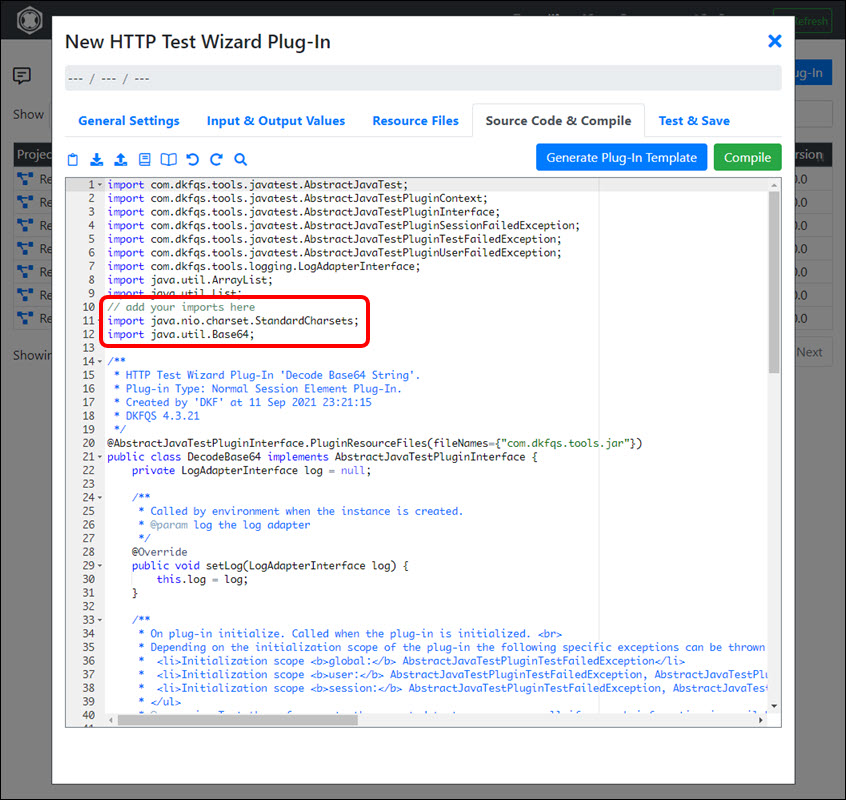
Now at the “Source Code & Compile” tab, you can first generate the plug-in template. Then you have to extend the generated code with your own code, ie in this example you have to complete the Java import definitions and program the inner logic of the Java method onExecute. Then compile the plug-in.
Java Doc of com.dkfqs.tools
The Java Doc for the packages of
com.dkfqs.tools is available at
download.realload.com


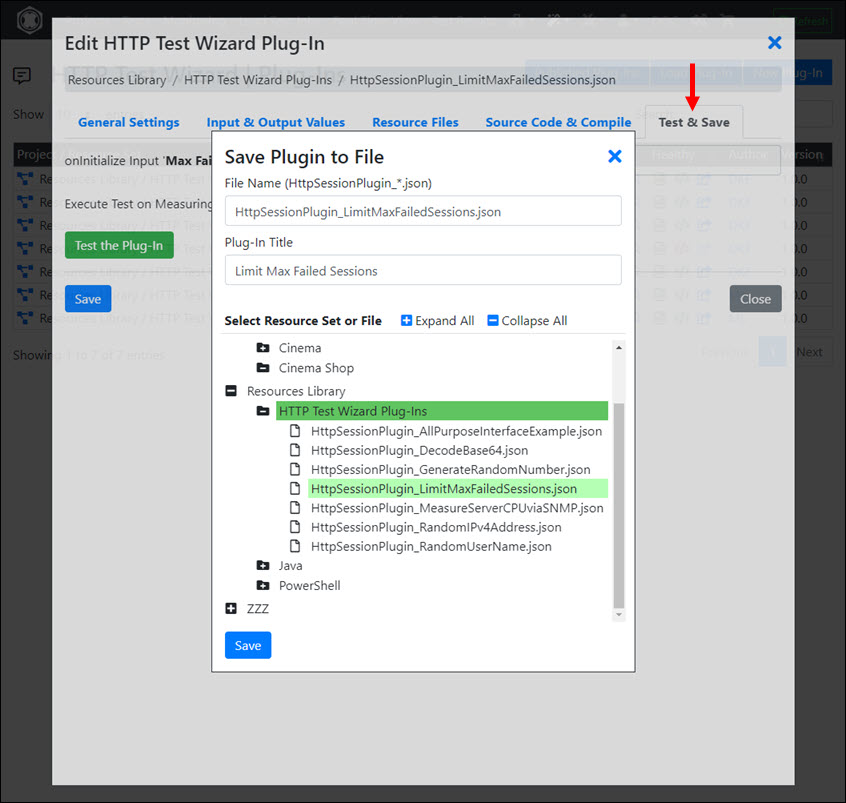
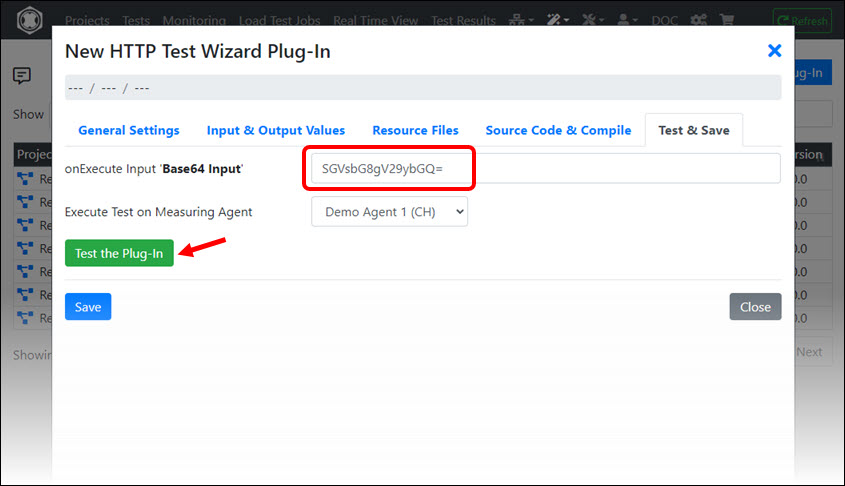
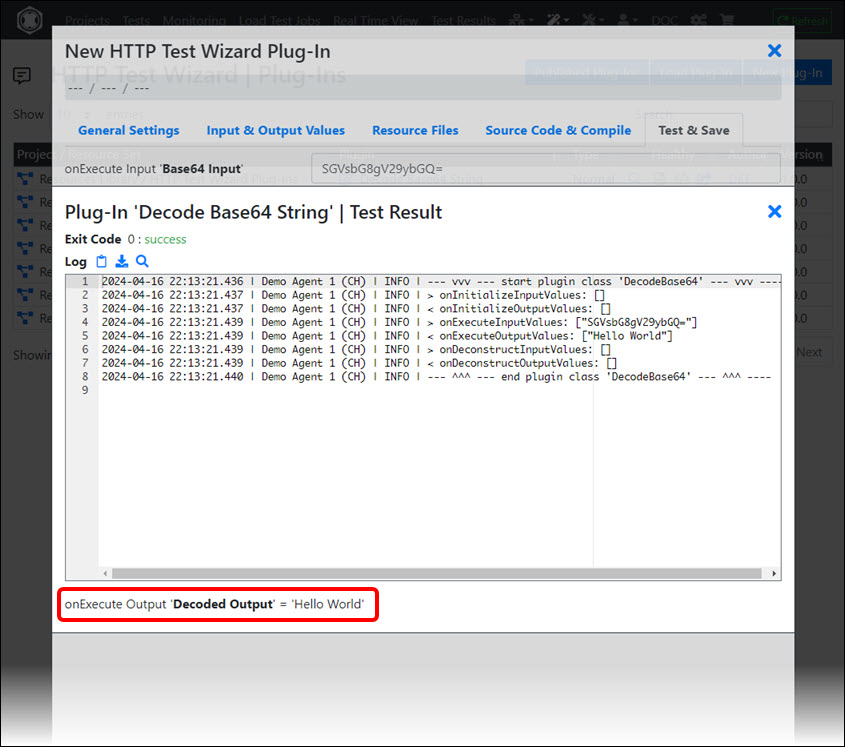
At the last tab “Test & Save” you can first test the plug-in (remotely) on any Measuring Agent. To perform the test enter for example “SGVsbG8gV29ybGQ=” as input and you will see as output “Hello World”.


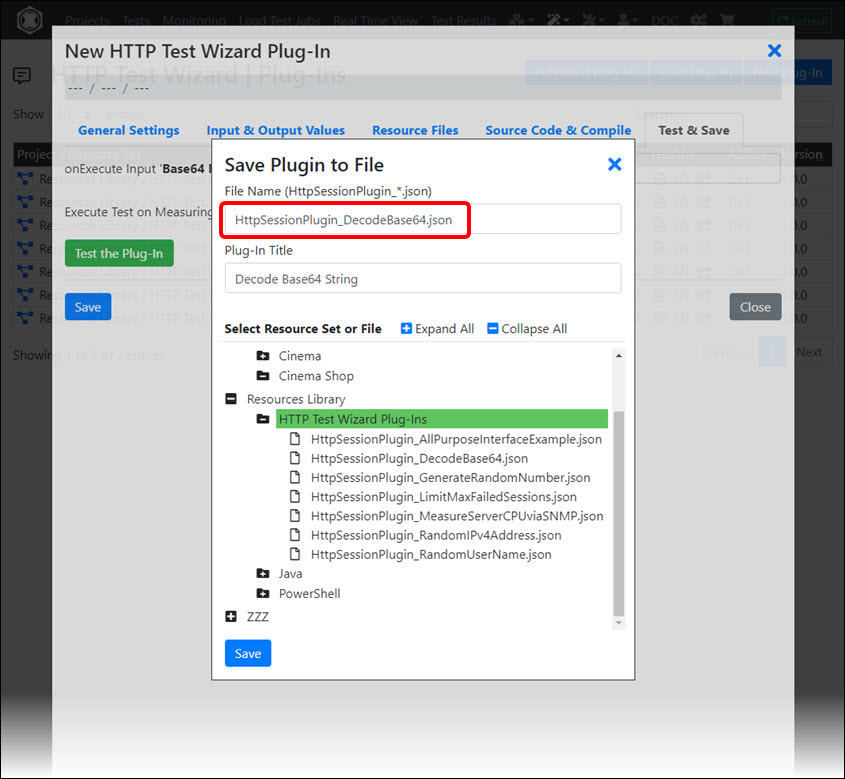
Finally save the plug-in:

After you have saved the plug-in click at the “Close” button. Then you will see the new plug-in in the plug-in list:

Publishing Plug-Ins
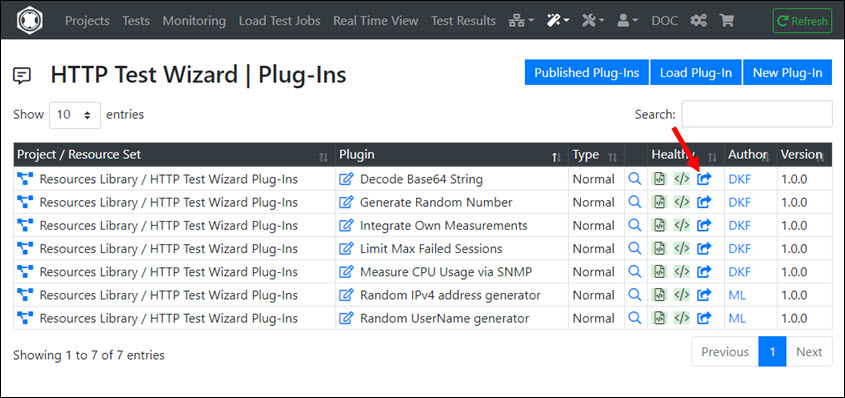
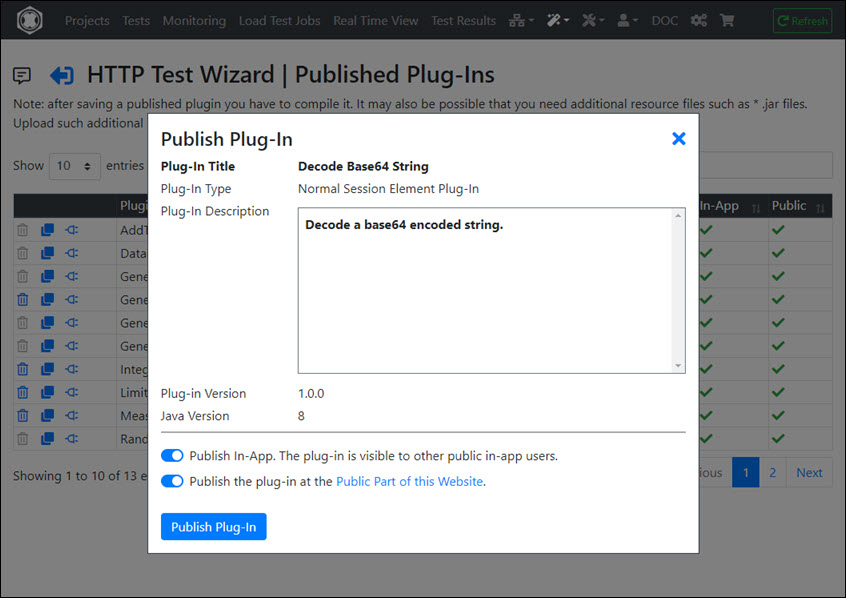
If your plug-in can be used universally, it would be nice if you also publish it - to make it available to other users.
Note that you have to enable in your Profile Settings the option “Public In-App User” in order that you entitled to publish plug-ins.
Publishing plug-ins is especially useful for users who have additionally activated the option “Publish My Profile as Technical Expert” in their Profile Settings. This will significantly improve your visibility and competence.


Debugger

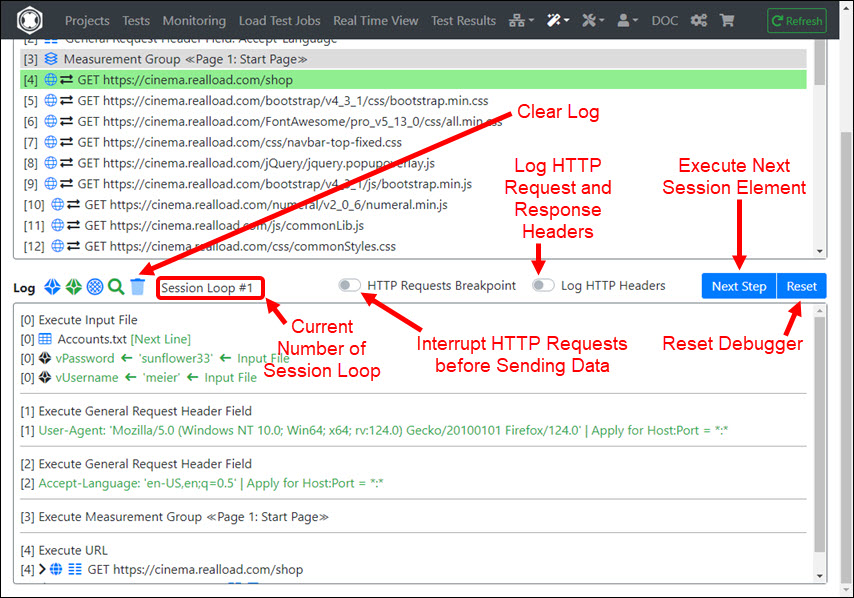
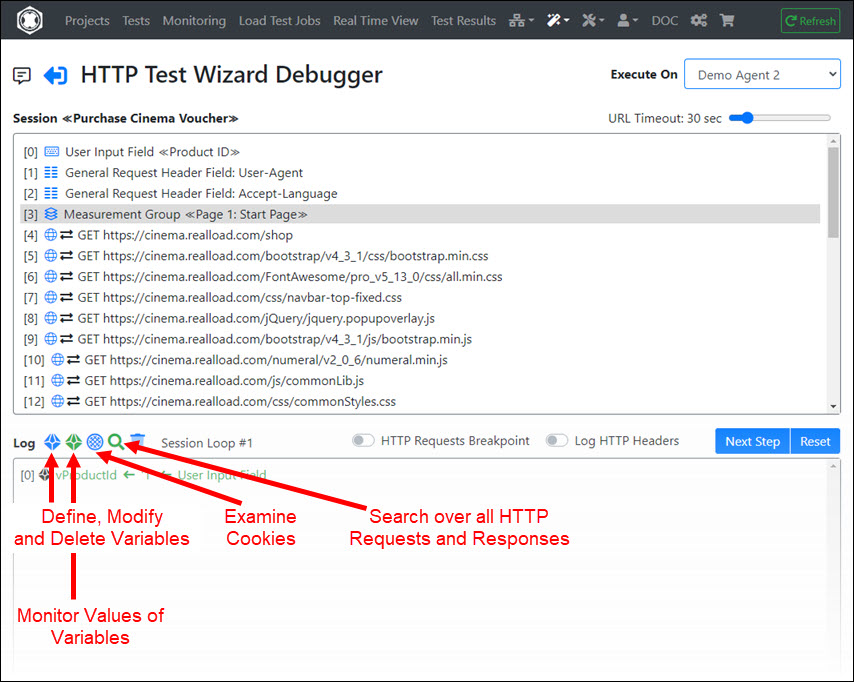
The HTTP Test Wizard Debugger is a powerful tool with some special features:
- It is a Remote Debugger, which means the instructions are always executed on a Measuring Agent. This also allows you to debug the session from different geographical locations.
- The debugger works directly with the definitions made in the HTTP Test Wizard - so there is no code to compile before debugging a session.
- During debugging, variables can also be defined, modified, and deleted.
- Values of variables can extracted from HTTP responses and assigned to HTTP requests (in addition/alternative to the Variables Wizard of the URL Explorer).
- All definitions made in the debugger regarding variables are synchronized with the HTTP Test Wizard session.
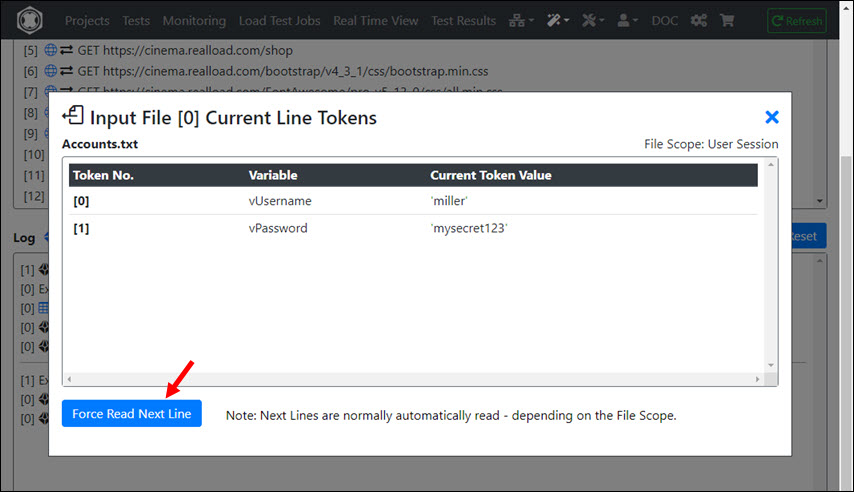
- You can force the debugger to jump over lines of Input Files.
- The value of HTTP Cookies can be examined and modified.
- The value of variables can be monitored in real-time.
- You can search for a text over all (so far) executed HTTP requests and responses.
Selecting the Measuring Agent
The executing Measuring Agent can be selected in the upper right corner. The debugger is reset when you select another Measuring Agent.

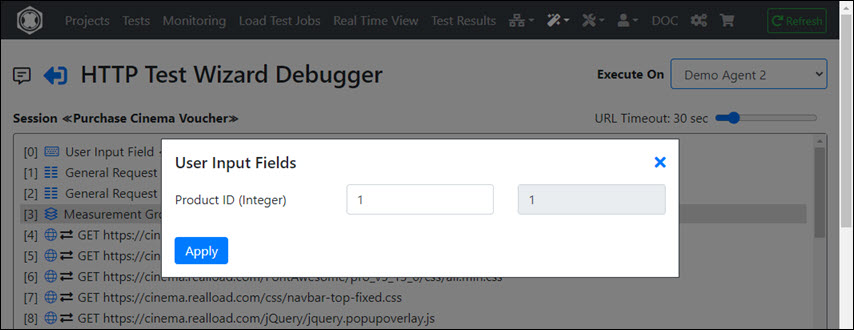
If your session contains User Input Fields, you will be prompted to enter their values when the debugger is initialized or reset.

Reading the lines of Input Files is automatically processed by the debugger. However you can force the debugger to jump over the lines of an Input File.


Debugging the Session
Click Next Step repeatedly to debug the session.
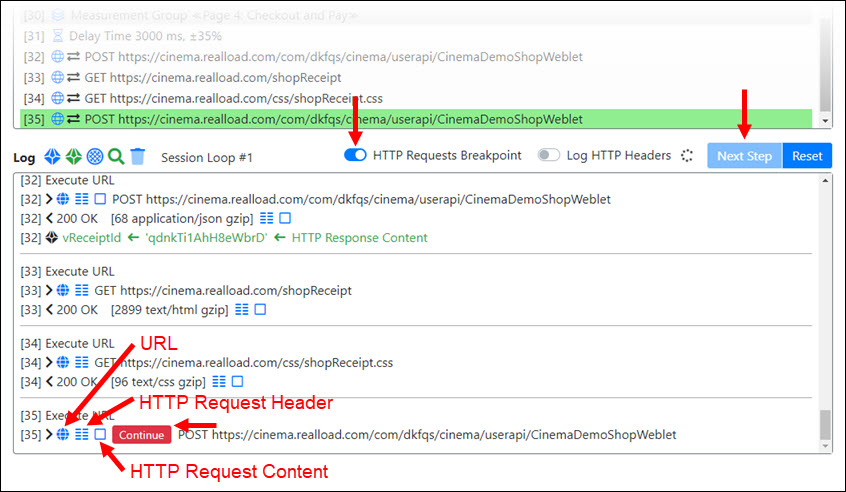
If you want to assign the value of a variable to an HTTP request, briefly enable HTTP Requests Breakpoint before the URL is executed. After that, you should disable this option.

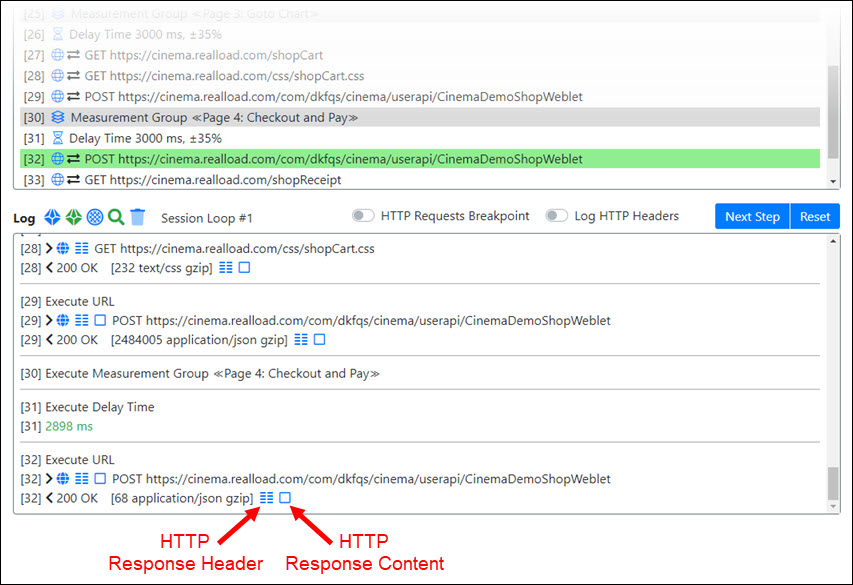
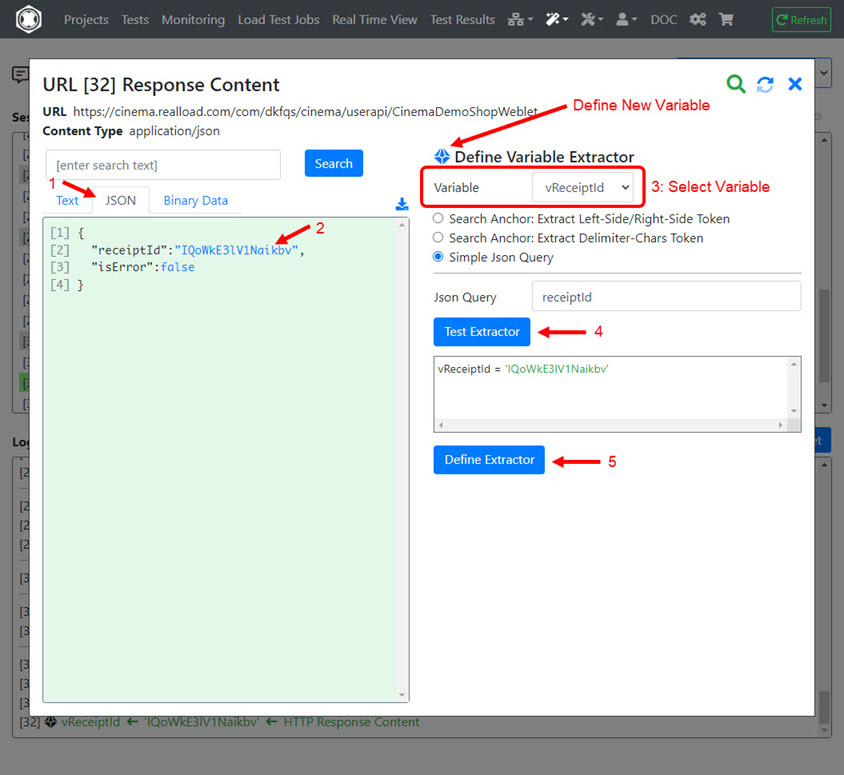
Click the received HTTP Response Header or Response Content of a URL to extract a value into a variable:

This example extracts the value of a JSON response into a variable. If the variable does not yet exist, you can define it first.

Assigning Values to HTTP Requests
Proceed as follows
- Enable ‘HTTP Requests Breakpoint’ before the URL is executed.
- Click ‘Next Step’. The data of the HTTP request is then initialized, but the request is stopped ‘in the middle’, meaning it is not yet sent to the HTTP(S) server.
- Assign the value to the URL, or to the HTTP Request Header, or to the HTTP Request Content.
- Disable ‘HTTP Requests Breakpoint’.
- Click ‘Continue’. The HTTP request is now sent to the HTTP(S) server.

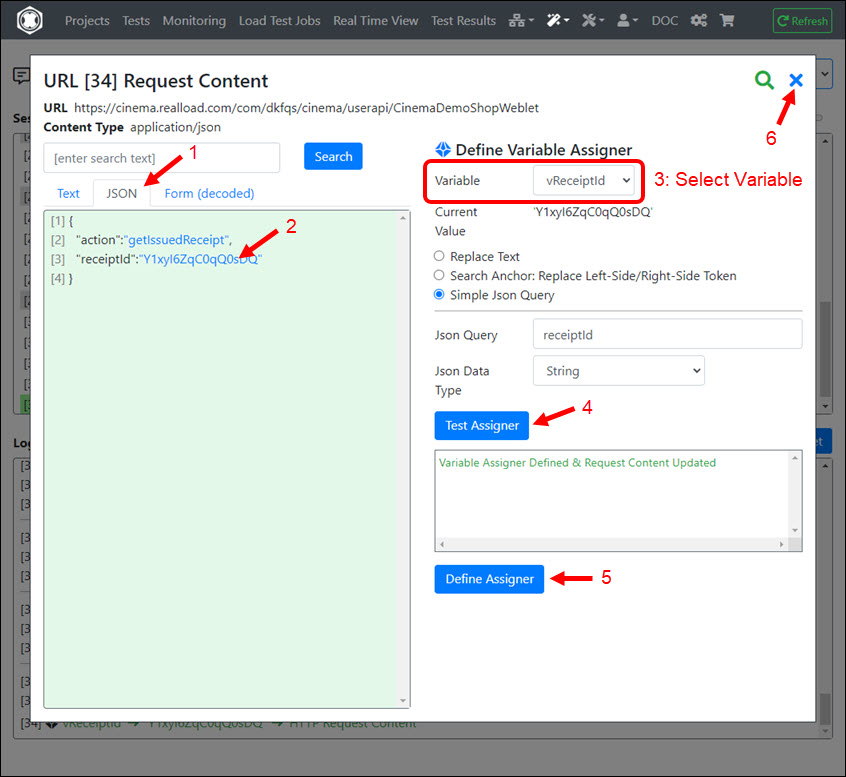
This example assigns the value of a variable to a JSON HTTP request content:

4 - HTTP/S Remote Proxy Recorder
User Guide | HTTP/S Remote Proxy Recorder

By using an HTTP/S Remote Proxy Recorder, the HTTP/S traffic from Web browsers and technical Web clients can be recorded and easily converted into a HTTP Test Wizard session.
The HTTP Test Wizard session can then be post-processed and debugged. Finally, an executable test can be generated from the recorded session.
If you do not operate your own HTTP/S Remote Proxy Recorder (or have us to operate it), a shared HTTP/S Remote Proxy Recorder from our pool will be assigned to you, which will be available temporarily to you, as long as you are logged into the portal. This means that when you log out and log back into the portal, a different shared HTTP/S Remote Proxy Recorder may be assigned to you.
Alternatively, you can install the Desktop Companion application on your computer. This application also has an integrated HTTP/S Proxy Recorder which has roughly the same functionality as a HTTP/S Remote Proxy Recorder.
Functional Overview: Remote Proxy Recorder

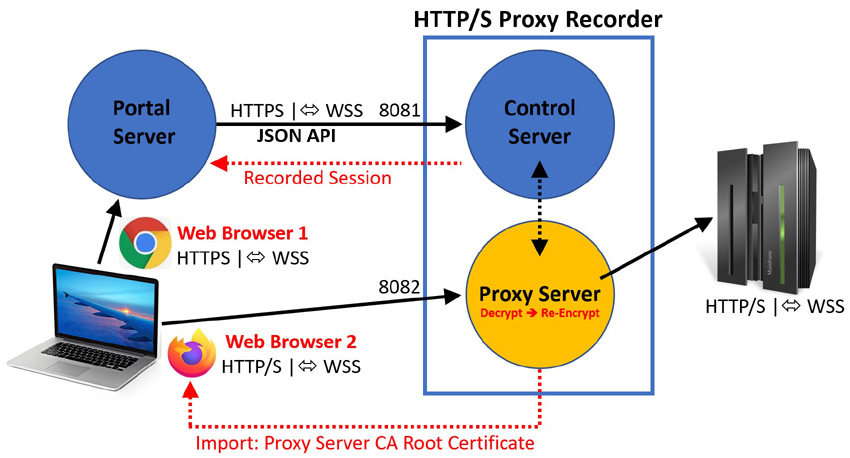
An HTTP/S Remote Proxy Recorder has two service ports:
- A Control Port that is addressed by the portal server.
- A Proxy Port that records the data traffic from a Web browser or from a technical Web client.
All data traffic that passes through the proxy port is first decrypted by the Proxy Recorder and then encrypted again before it is forwarded to the target Web server(s).
In order to record a Web surfing session by a Web browser you have to start two different Web browser products on your local machine. For example:
- A Chrome browser to operate the portal server (Web Browser 1), and
- A Firefox browser to record the Web surfing session (Web Browser 2)
We recommend to use always Firefox as Web Browser 2.
To be able to record a Web surfing session, you have to reconfigure Web Browser 2
Additional note: Before you start recording a Web surfing session in Web Browser 2, you must always clear the browser cache.
Once the recording is completed you should undo the configuration changes in Web Browser 2 (restore the original network settings and delete the Proxy Server CA Root Certificate).
Importing the Proxy Recorder CA Root Certificate into the Web Browser
The following describes how you can import the CA Root Certificate of a Proxy Recorder in the Firefox Web Browser.
Sign in to the portal, navigate to the HTTP/S Remote Proxy Recorders menu, and download the CA Root Certificate of the Proxy Recorder to any folder on your computer:


Note: The image above shows the certificate of a shared proxy recorder (whereby all shared proxy recorders use the same CA root certificate). However, the ‘Subject’ of the certificate could also have other values, depending on the proxy recorder. So that you can find the certificate in Firefox and delete it if necessary, you should remember the values of the ‘Certificate Subject’ (or take a photo of the certificate properties with your mobile phone).
In Firefox call Settings:

Click Privacy & Security:

Scroll down to Security - Certificates, and click ‘View Certificates…’

In the Firefox Certificate Manager click first on Authorities and then on ‘Import…’

Select the CA Root Certificate you downloaded before and check the “Trust this CA to identify websites” box. Then click OK

The CA Root Certificate is now imported into Firefox:

Important Security Notice
After you have installed a Proxy Recorder’s CA Root Certificate in a web browser product (in this case, Firefox), you can record web surfing sessions, but you can no longer trust the web browser itself, because if someone else has accesses to the same CA Root Certificate, you can be cheated - without the corresponding web browser issuing a warning.
This is especially important if you use a Shared Proxy Recorder or the Desktop Companion application. This means that you should never use such a web browser for financial-critical transactions such as e-banking - or for logging into personal websites, as long as a proxy recorder’s CA root certificate is installed in the browser. Only after removing the CA root certificate from the browser is it safe again.
This security problem is not so critical if you operate your own HTTP/S Remote Proxy Recorder (or have us operate it). But even in this case, you could theoretically be cheated by your team members.
So the most secure way is to remove the proxy recorder’s CA root certificate from the web browser as soon as your recording is done.
Recording of Web Surfing Sessions
Once you have Imported the Proxy Recorder CA Root Certificate into the Web Browser and have installed the ‘RealLoad Test Recorder’ browser extension you are ready to Record Web Surfing Sessions and convert them into RealLoad Tests.

