Developing a JUnit Monitoring Test
This example shows a JUnit Test that executes a DNS query to resolve and verify a hostname of a domain.
This document explains:
The All Purpose Interface is the core of the product.
The architecture and the provided components that support this interface are referred as the Real Load Platform, which is optimized for performing load and stress tests with thousands of concurrent users.
This interface can be implemented by any programming language and regulates:
What requirements a script or program must comply in order to be executed by the Real Load Platform.
How the runtime behavior of the simulated users and the measured data of a script or program are reported to the Real Load Platform.
The great advantage of using the Real Load Platform is that only the basic functionality of a test has to be implemented. The powerful features of the Real Load Platform takes care of everything else, such as executing tests on remote systems and displaying the measured results in the form of diagrams, tables and statistics - in real time as well as final test result.
The product’s open architecture enables you to develop plug-ins, scripts and programs that measure anything that has numeric value - no matter which protocol is used!
The measured data are evaluated in real time and displayed as diagrams and lists. In addition to successfully measured values, also errors like timeouts or invalid response data can be collected and displayed in real time.
At least in theory, programs and scripts of any programming language can be executed, as long as such a program or script supports the All Purpose Interface.
In practice there are currently two options for integrating your own measurements into the Real Load Platform:
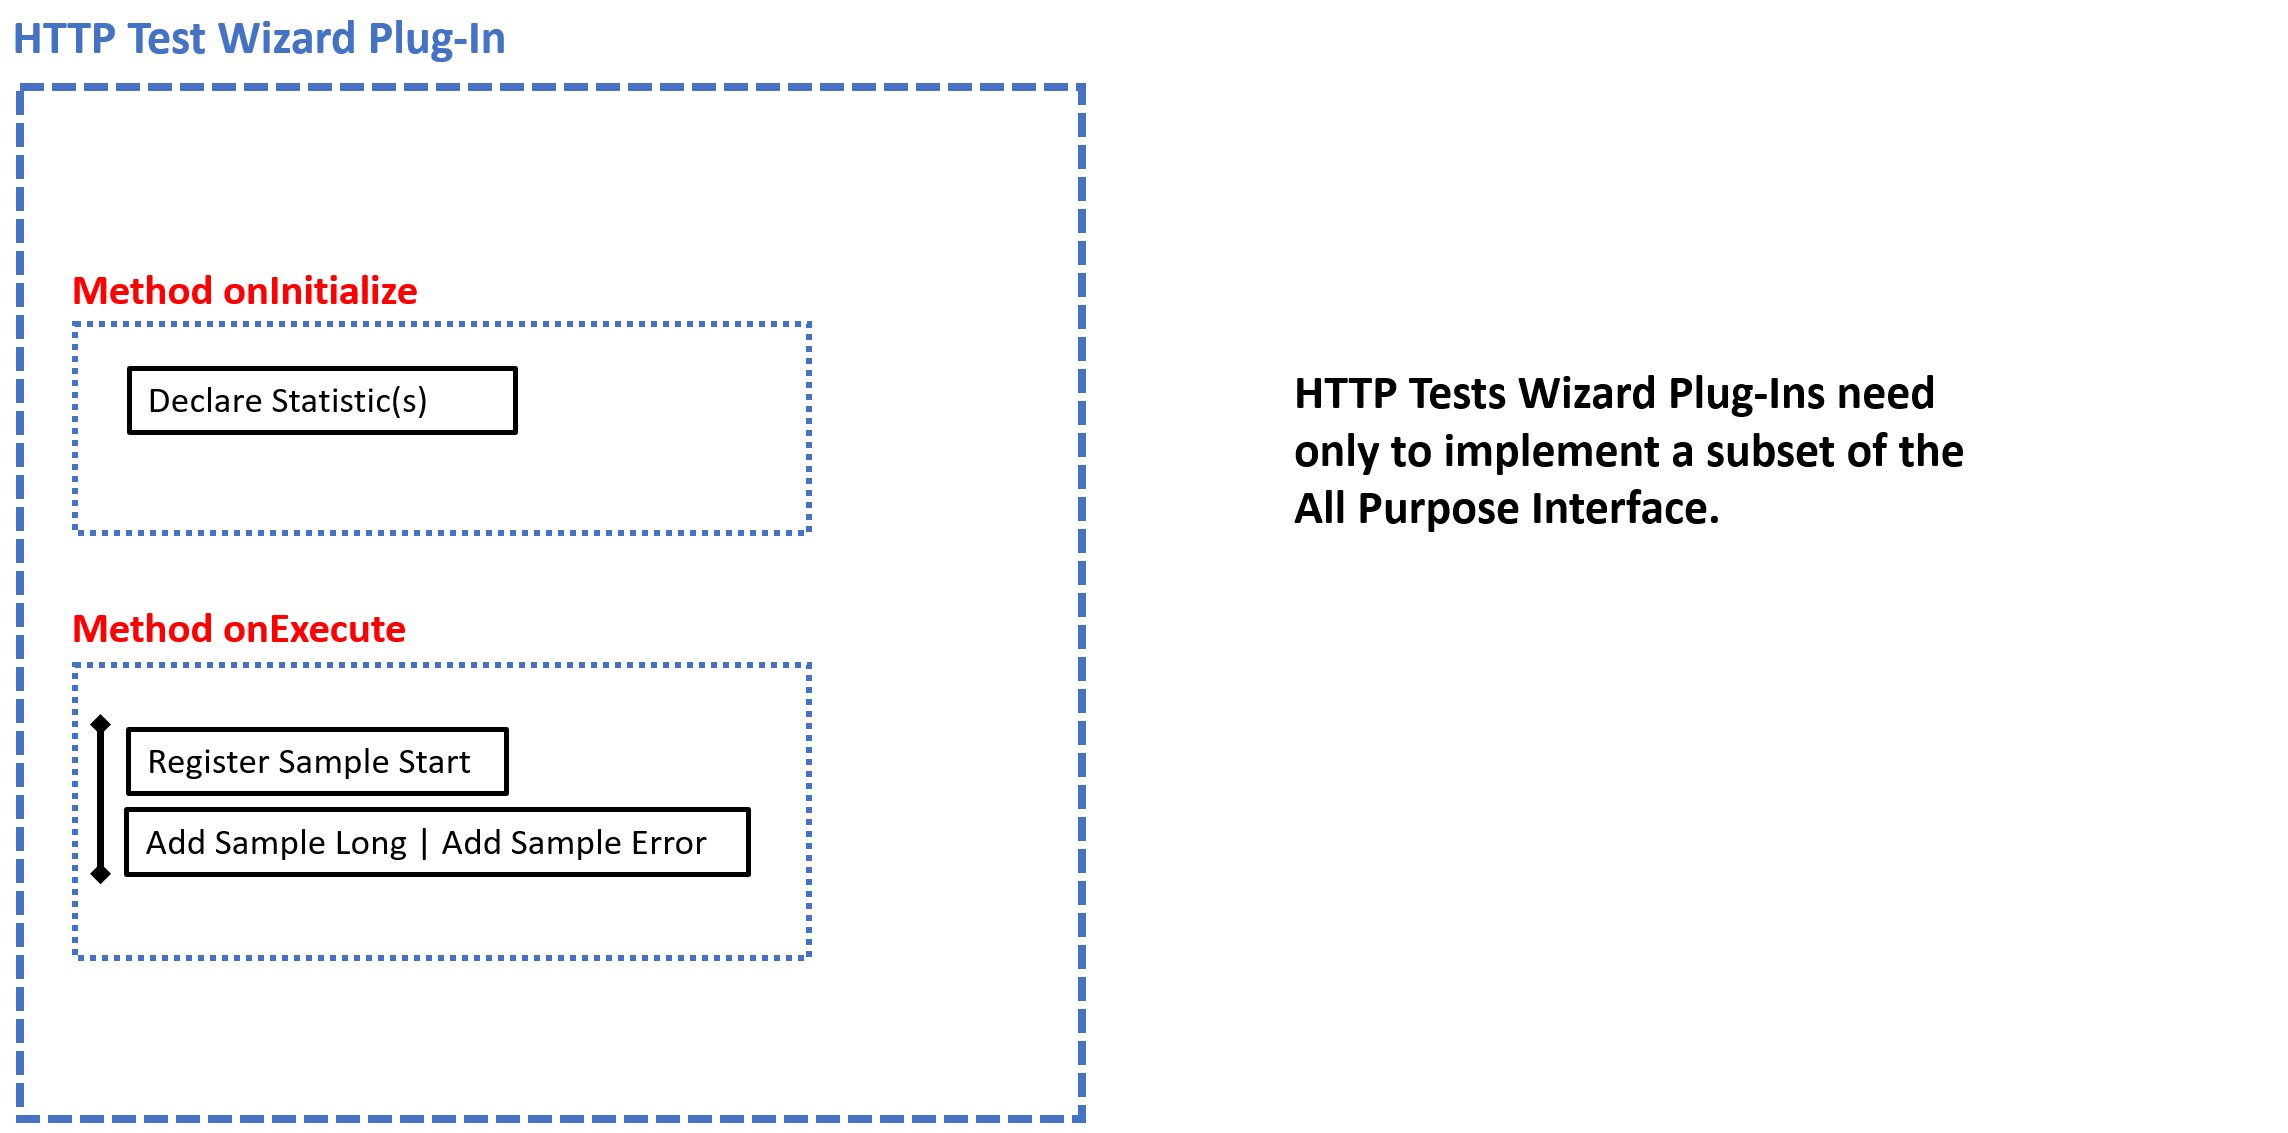
Write an HTTP Test Wizard Plug-In in Java that performs the measurement. This has the advantage that you only have to implement a subset of the “All Purpose Interface” yourself:
Such plug-ins can be developed quite quickly, as all other functions of the “All Purpose Interface” are already implemented by the HTTP Test Wizard.
Tip: An HTTP Test Wizard session can also only consist of plug-ins, i.e. you can “misuse” the HTTP Test Wizard to only carry out measurements that you have programmed yourself: Plug-In Example
Write a test program or from scratch. This can currently be programmed in Java or PowerShell (support for additional programming languages will be added in the future). This is more time-consuming, but has the advantage that you have more freedom in program development. In this case you have to implement all functions of the “All Purpose Interface”.
The All Purpose Interface must be implemented by all programs and scripts which are executed on the Real Load Platform. The interface is independent of any programming language and has only three requirements:
All of this seems a bit trivial, but has been chosen deliberately. So that the interface can support almost all programming languages.
Each executed program or script must support at least the following arguments:
Implementation Note: The test ends if either the Test Duration is elapsed or if Max Session Loops are reached for all simulated users. Currently executed sessions are not aborted.
In addition, the following arguments are optional, but also standardized:
| Argument | Java | PowerShell |
|---|---|---|
| Number of Users | -users number | -totalUsers number |
| Test Duration | -duration seconds | -inputTestDuration seconds |
| Ramp Up Time | -rampupTime seconds | -rampUpTime seconds |
| Max Session Loops | -maxLoops number | -inputMaxLoops number |
| Delay Per Session Loop | -delayPerLoop milliseconds | -inputDelayPerLoopMillis milliseconds |
| Data Output Directory | -dataOutputDir path | -dataOutDirectory path |
| Description | -description text | -description text |
| Debug Execution | -debugExec | -debugExecution |
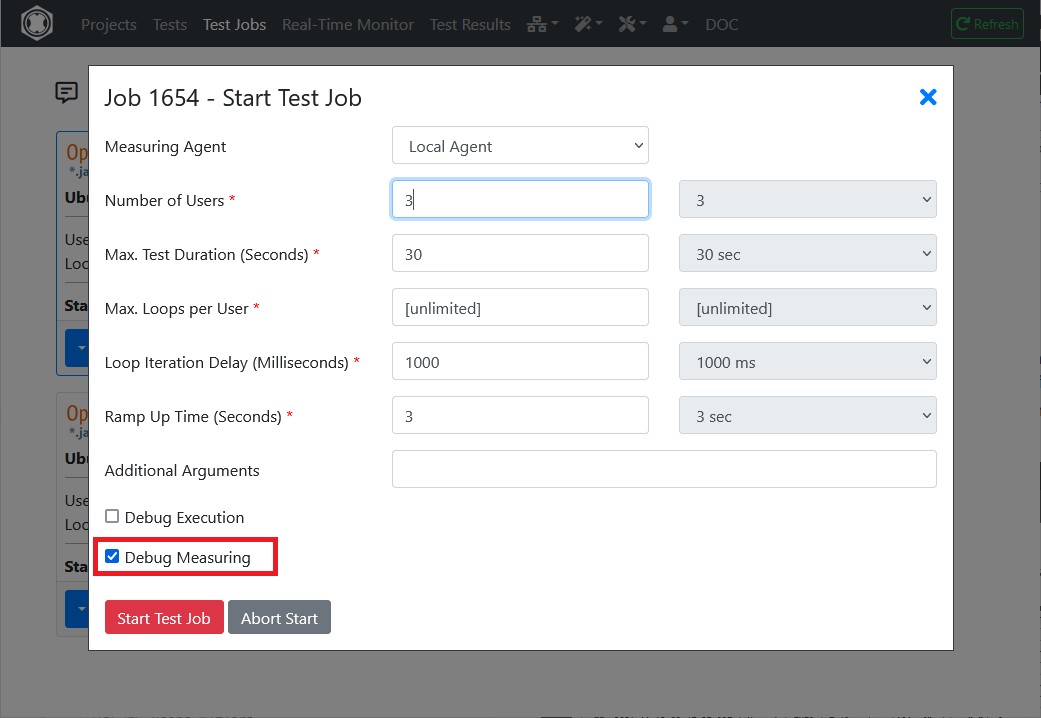
| Debug Measuring | -debugData | -debugMeasuring |
For scripts which don’t support multiple threads the Real Load Platform starts for each simulated user a own operating system process per simulated user. On the other hand, for programs which support multiple threads, only one operating system process is started for all simulated users.
Scripts which are not able to run multiple threads must support the following additional generic command line argument:
| Argument | PowerShell |
|---|---|
| Executed User Number | -inputUserNo number |
Additional program and script specific arguments are supported by the Real Load Platform. Hoverer, their values are not validated by the platform.
During the execution of a test the Real Load Platform can create and delete at runtime additional control files in the Data Output Directory of a test job. The existence, and respectively the absence of such control files must be frequently checked by the running script or program, but not too often to avoid CPU and I/O overload. Rule of thumb: Multi-threaded programs should check the existence of such files every 5..10 seconds. Single-threaded scripts should check such files before executing a new session loop iteration.
The following control files are created or removed in the Data Output Directory by the Real Load Platform:
When a test job is started by the Real Load Platform on a Measuring Agent, then the Real Load Platform creates at first for each simulated user an empty data file in the Data Output Directory of the test job:
Data File: user_<Executed User Number>_statistics.out
Example: user_1_statistics.out, user_2_statistics.out, user_3_statistics.out, .. et cetera.
After that, the test script(s) or test program is started as operating system process. The test script or the test program has to write the current state of the simulated user and measured data to the corresponding Data File of the simulated user in JSON object format (append data to the file only – don’t create new files).
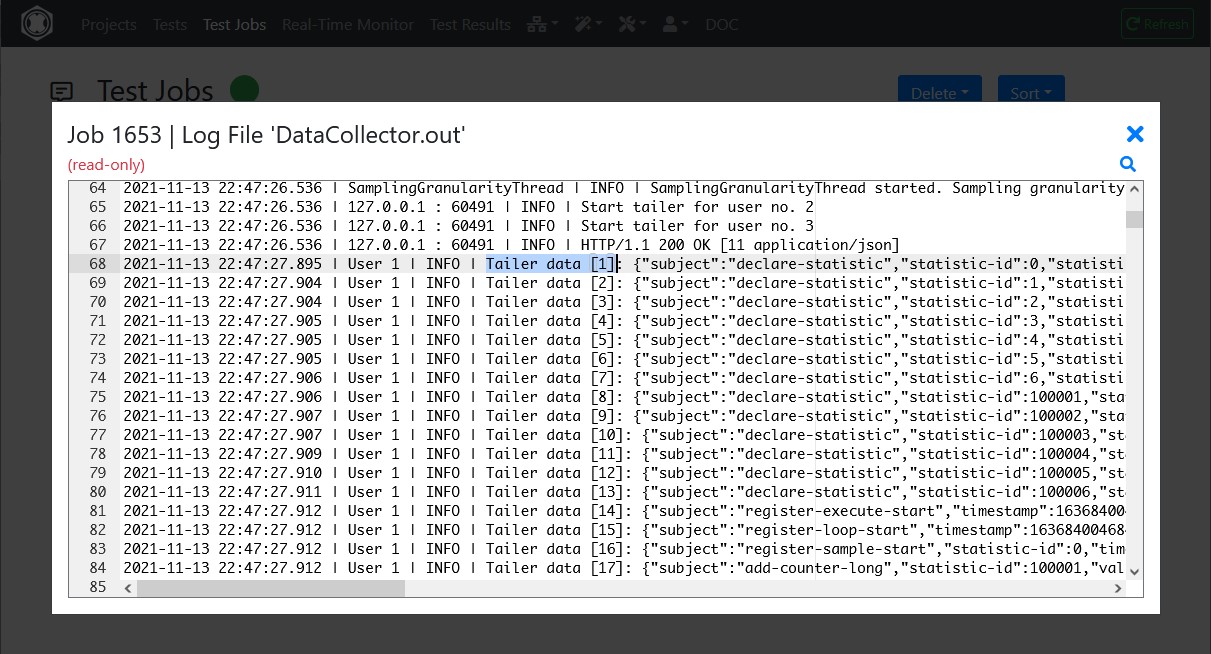
The Real Load Platform component Measuring Agent and the corresponding Data Collector are listening to these data files and interpret the measured data at real-time, line by line as JSON objects.
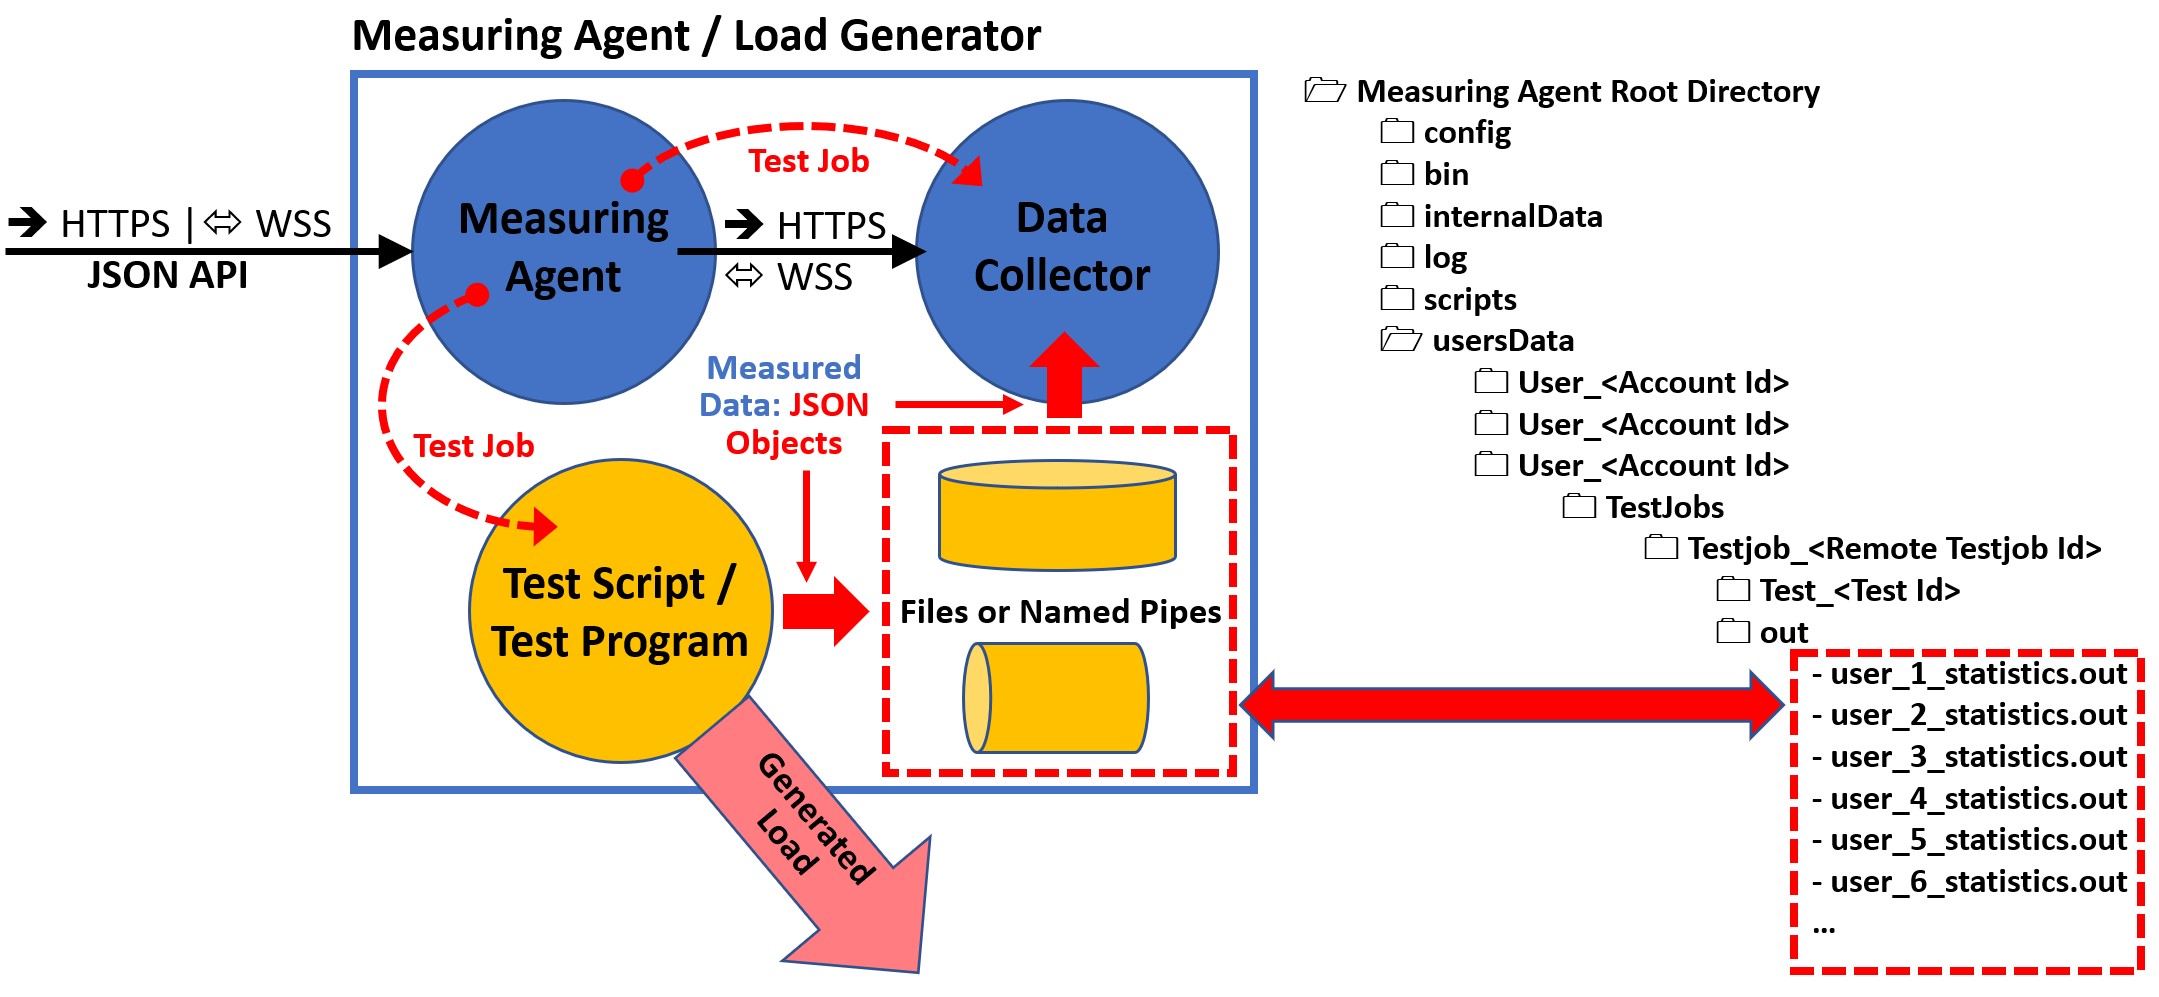
The following JSON Objects can be written to the Data Files:
| JSON Object | Description |
|---|---|
| Declare Statistic | Declare a new statistic |
| Register Execute Start | Registers the start of a user |
| Register Execute Suspend | Registers that the execution of a user is suspended |
| Register Execute Resume | Registers that the execution of a user is resumed |
| Register Execute End | Registers that a user has ended |
| Register Loop Start | Registers that a user has started a session loop iteration |
| Register Loop Passed | Registers that a session loop iteration of a user has passed |
| Register Loop Failed | Registers that a session loop iteration of a user has failed |
| Register Sample Start | Statistic-type sample-event-time-chart: Registers the start of measuring a sample |
| Add Sample Long | Statistic-type sample-event-time-chart: Registers that a sample has measured and report the value |
| Add Sample Error | Statistic-type sample-event-time-chart: Registers that the measuring of a sample has failed |
| Add Counter Long | Statistic-type cumulative-counter-long: Add a positive delta value to the counter |
| Add Average Delta And Current Value | Statistic-type average-and-current-value: Add delta values to the average and set the current value |
| Add Efficiency Ratio Delta | Statistic-type efficiency-ratio-percent: Add efficiency ratio delta values |
| Add Throughput Delta | Statistic-type throughput-time-chart: Add a delta value to a throughput |
| Add Error | Add an error the test result |
| Add Test Result Annotation Exec Event | Add an annotation event to the test result |
Note that the data of each JSON object must be written as a single line which end with a \r\n line terminator.
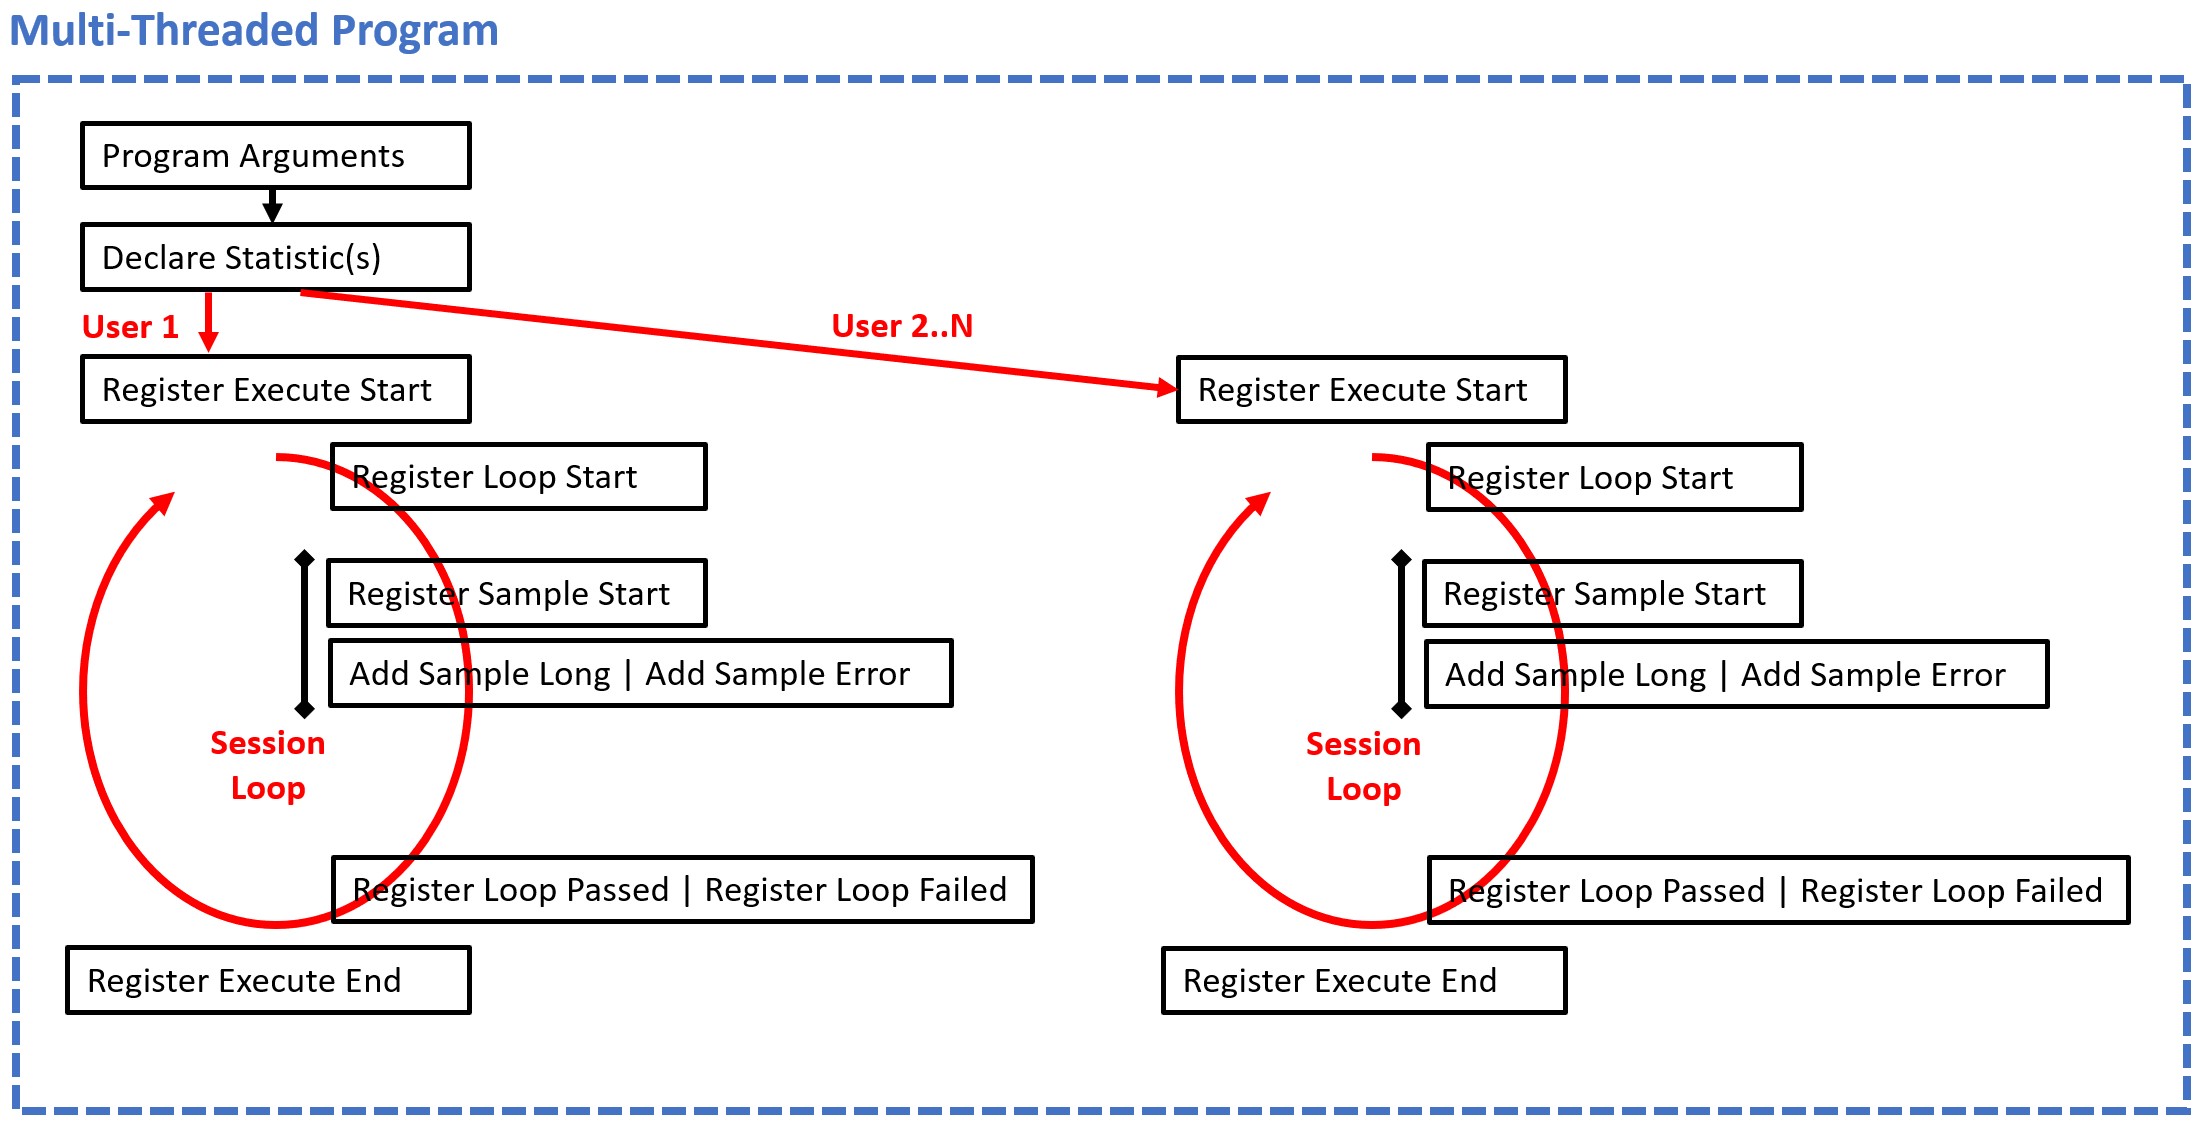
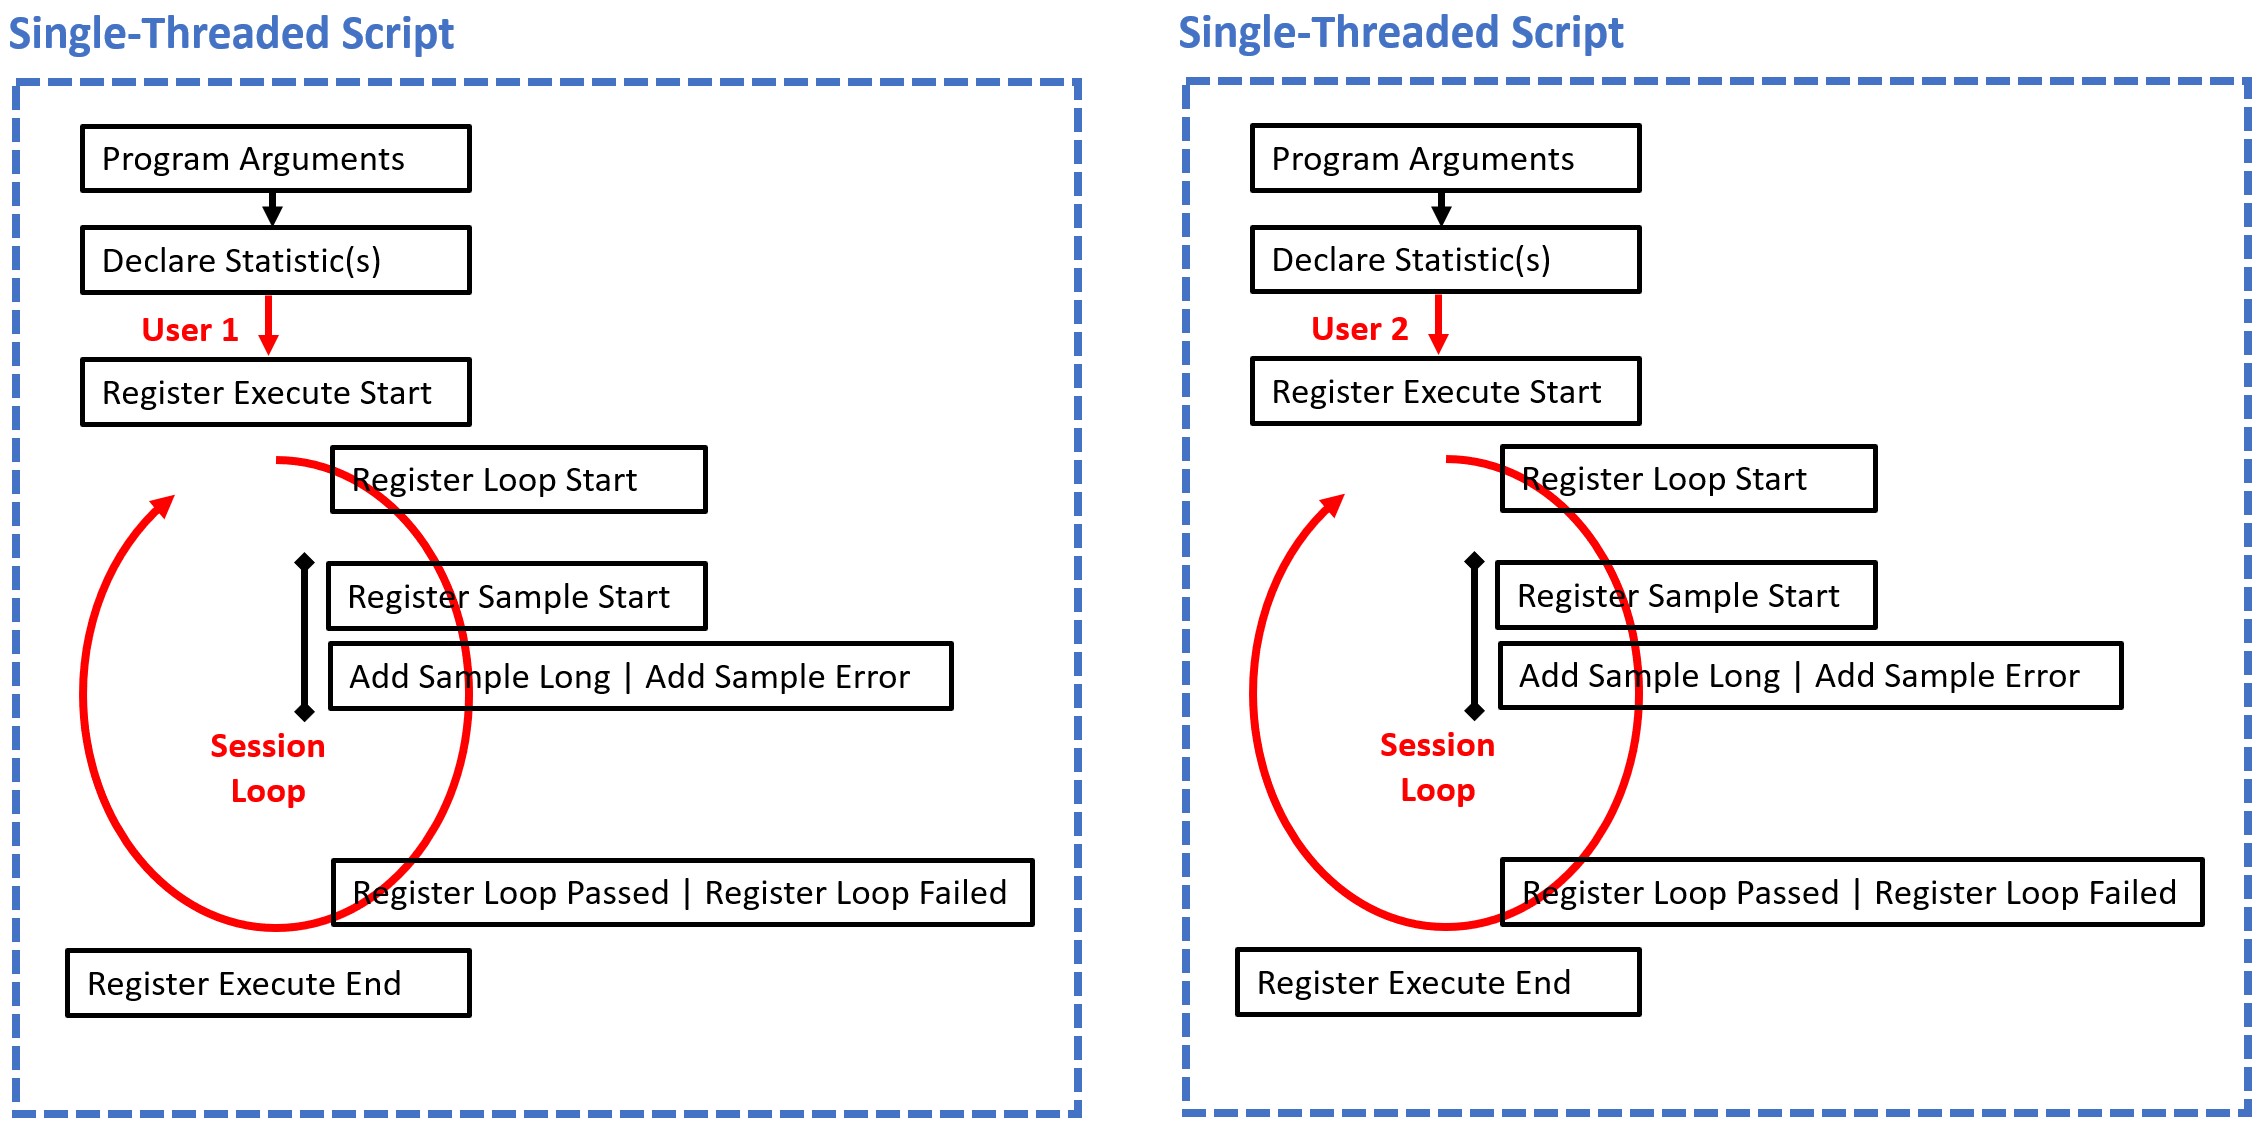
Before the measurement of data begins, the corresponding statistics must be declared at runtime. Each declared statistic must have a unique ID. Multiple declarations with the same ID are crossed out by the platform.
Currently 5 types of statistics are supported:
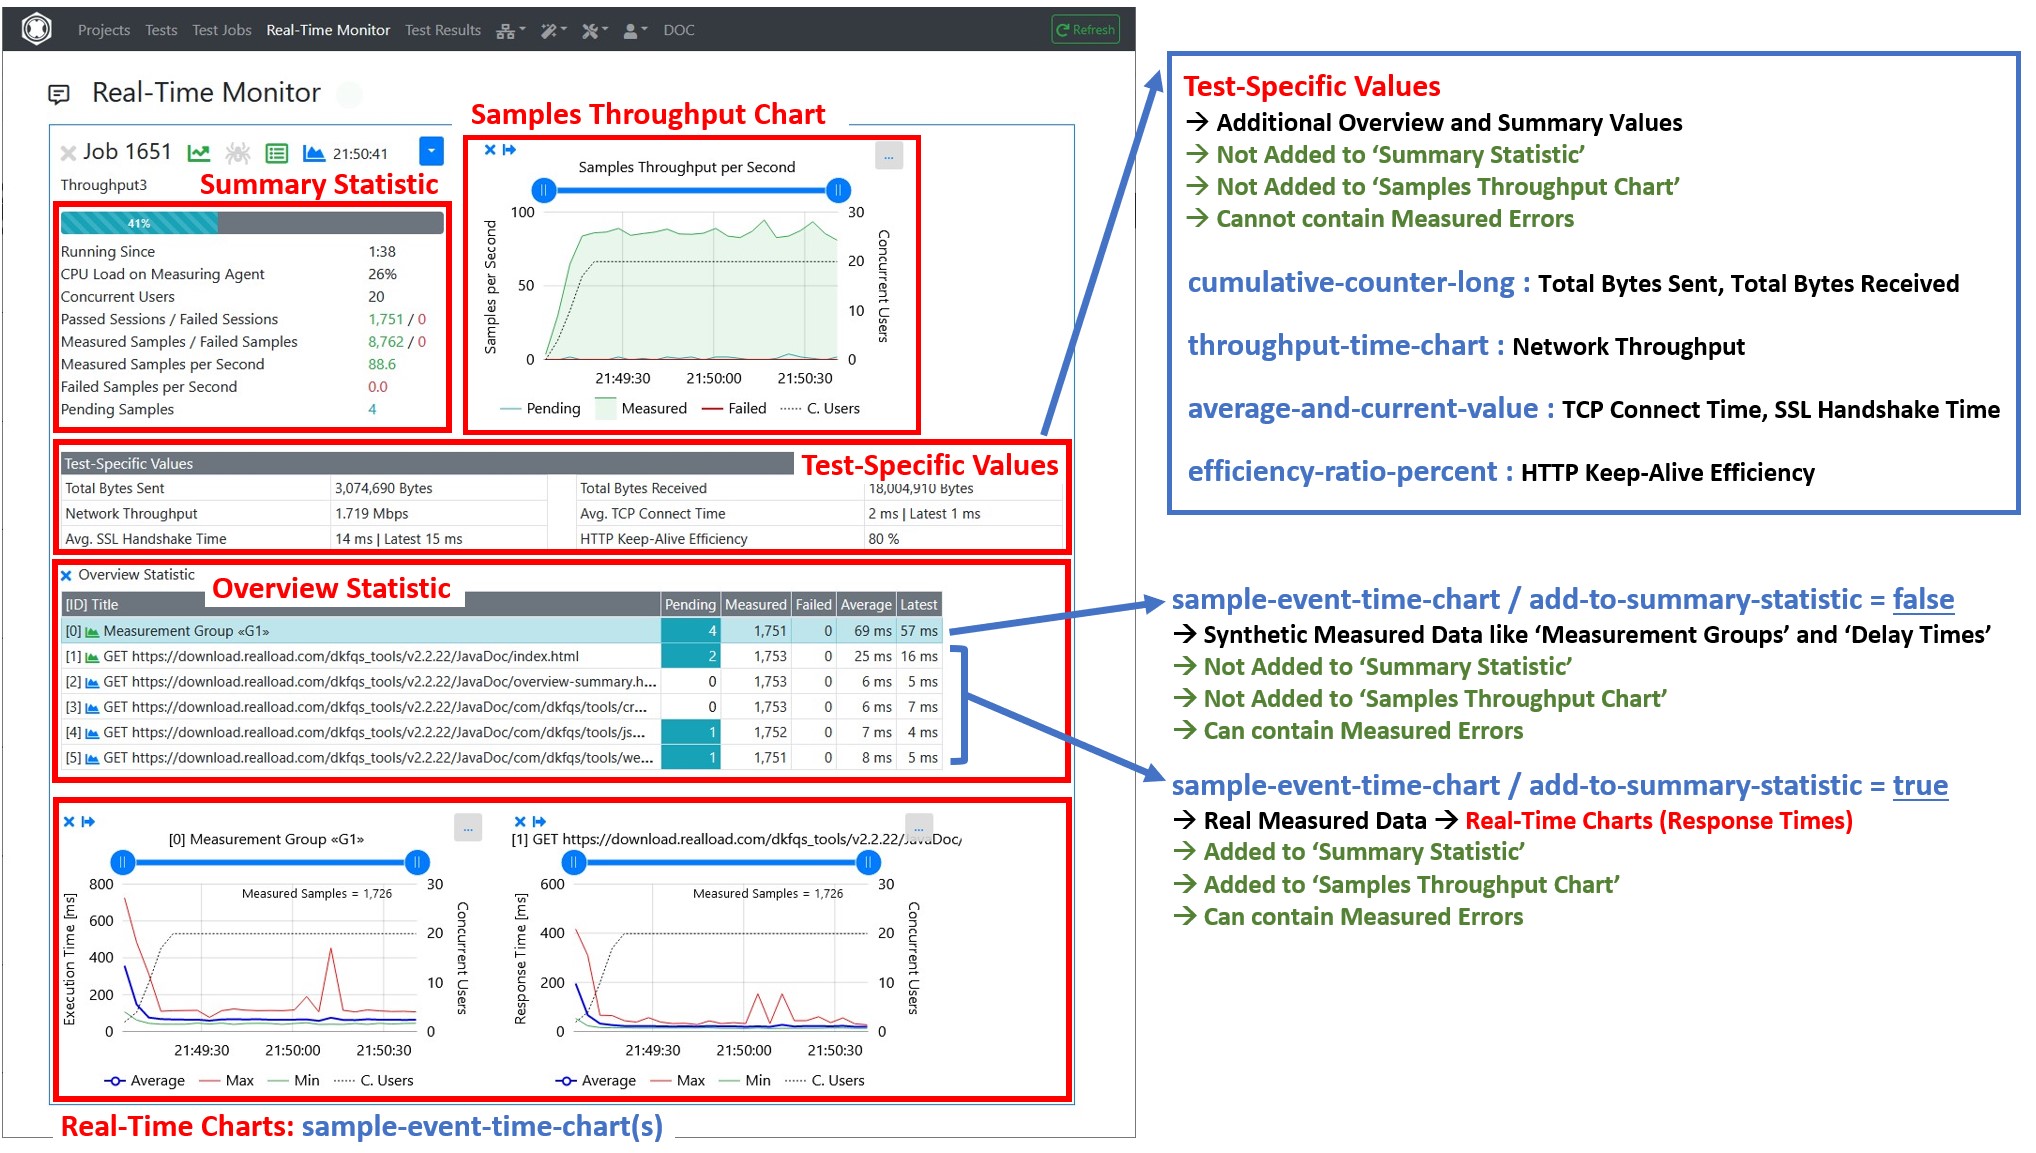
It’s also supported to declare new statistics at any time during test execution, but the statistics must be declared first, before the measured data are added.
{
  "$schema": "http://json-schema.org/draft/2019-09/schema",
  "title": "DeclareStatistic",
  "type": "object",
  "required": ["subject", "statistic-id", "statistic-type", "statistic-title"],
  "properties": {
    "subject": {
      "type": "string",
      "description": "Always 'declare-statistic'"
    },
    "statistic-id": {
      "type": "integer",
      "description": "Unique statistic id"
    },
    "statistic-type": {
      "type": "string",
      "description": "'sample-event-time-chart' or 'cumulative-counter-long' or 'average-and-current-value' or 'efficiency-ratio-percent' or 'throughput-time-chart'"
    },
    "statistic-title": {
      "type": "string",
      "description": "Statistic title"
    },
    "statistic-subtitle": {
      "type": "string",
      "description": "Statistic subtitle | only supported by 'sample-event-time-chart'"
    },
    "y-axis-title": {
      "type": "string",
      "description": "Y-Axis title | only supported by 'sample-event-time-chart'. Example: 'Response Time'"
    },
    "unit-text": {
      "type": "string",
      "description": "Text of measured unit. Example: 'ms'"
    },
    "sort-position": {
      "type": "integer",
      "description": "The UI sort position"
    },
    "add-to-summary-statistic": {
      "type": "boolean",
      "description": "If true = add the number of measured and failed samples to the summary statistic | only supported by 'sample-event-time-chart'. Note: Synthetic measured data like Measurement Groups or Delay Times should not be added to the summary statistic"
    },
    "background-color": {
      "type": "string",
      "description": "The background color either as #hex-triplet or as bootstrap css class name, or an empty string = no special background color. Examples: '#cad9fa', 'table-info'"
    }
  }
}

Example:
{
  "subject":"declare-statistic",
  "statistic-id":1,
  "statistictype":"sample-event-time-chart",
  "statistic-title":"GET http://192.168.0.111/",
  "statistic-subtitle":"",
  "y-axis-title":"Response Time",
  "unit-text":"ms",
  "sort-position":1,
  "add-to-summarystatistic":true,
  "background-color":""
}
After the statistics are declared then the activities of the simulated users can be started. Each simulated user must report the following changes of the current user-state:
{
  "$schema": "http://json-schema.org/draft/2019-09/schema",
  "title": "RegisterExecuteStart",
  "type": "object",
  "required": ["subject", "timestamp"],
  "properties": {
    "subject": {
      "type": "string",
      "description": "Always 'register-execute-start'"
    },
    "timestamp": {
      "type": "integer",
      "description": "Unix-like time stamp"
    }
  }
}

Example:
{"subject":"register-execute-start","timestamp":1596219816129}
{
  "$schema": "http://json-schema.org/draft/2019-09/schema",
  "title": "RegisterExecuteSuspend",
  "type": "object",
  "required": ["subject", "timestamp"],
  "properties": {
    "subject": {
      "type": "string",
      "description": "Always 'register-execute-suspend'"
    },
    "timestamp": {
      "type": "integer",
      "description": "Unix-like time stamp"
    }
  }
}

Example:
{"subject":"register-execute-suspend","timestamp":1596219816129}
{
  "$schema": "http://json-schema.org/draft/2019-09/schema",
  "title": "RegisterExecuteResume",
  "type": "object",
  "required": ["subject", "timestamp"],
  "properties": {
    "subject": {
      "type": "string",
      "description": "Always 'register-execute-resume'"
    },
    "timestamp": {
      "type": "integer",
      "description": "Unix-like time stamp"
    }
  }
}

Example:
{"subject":"register-execute-resume","timestamp":1596219816129}
{
  "$schema": "http://json-schema.org/draft/2019-09/schema",
  "title": "RegisterExecuteEnd",
  "type": "object",
  "required": ["subject", "timestamp"],
  "properties": {
    "subject": {
      "type": "string",
      "description": "Always 'register-execute-end'"
    },
    "timestamp": {
      "type": "integer",
      "description": "Unix-like time stamp"
    }
  }
}

Example:
{"subject":"register-execute-end","timestamp":1596219816129}
Once a simulated user has started its activity it measures the data in so called ‘session loops’. Each simulated must report when a session loop iteration starts and ends:
{
  "$schema": "http://json-schema.org/draft/2019-09/schema",
  "title": "RegisterLoopStart",
  "type": "object",
  "required": ["subject", "timestamp"],
  "properties": {
    "subject": {
      "type": "string",
      "description": "Always 'register-loop-start'"
    },
    "timestamp": {
      "type": "integer",
      "description": "Unix-like time stamp"
    }
  }
}

Example:
{"subject":"register-loop-start","timestamp":1596219816129}
{
  "$schema": "http://json-schema.org/draft/2019-09/schema",
  "title": "RegisterLoopPassed",
  "type": "object",
  "required": ["subject", "loop-time", "timestamp"],
  "properties": {
    "subject": {
      "type": "string",
      "description": "Always 'register-loop-passed'"
    },
    "loop-time": {
      "type": "integer",
      "description": "The time it takes to execute the loop in milliseconds"
    },
    "timestamp": {
      "type": "integer",
      "description": "Unix-like time stamp"
    }
  }
}

Example:
{"subject":"register-loop-passed","loop-time":1451, "timestamp":1596219816129}
{
  "$schema": "http://json-schema.org/draft/2019-09/schema",
  "title": "RegisterLoopFailed",
  "type": "object",
  "required": ["subject", "timestamp"],
  "properties": {
    "subject": {
      "type": "string",
      "description": "Always 'register-loop-failed'"
    },
    "timestamp": {
      "type": "integer",
      "description": "Unix-like time stamp"
    }
  }
}

Example:
{"subject":"register-loop-failed","timestamp":1596219816129}
Within a session loop iteration the samples of the declared statistics are measured. For sample-event-time-chart statistics the simulated user must report when the measuring of a sample starts and ends:
{
  "$schema": "http://json-schema.org/draft/2019-09/schema",
  "title": "RegisterSampleStart",
  "type": "object",
  "required": ["subject", "statistic-id", "timestamp"],
  "properties": {
    "subject": {
      "type": "string",
      "description": "Always 'register-sample-start'"
    },
    "statistic-id": {
      "type": "integer",
      "description": "The unique statistic id"
    },
    "timestamp": {
      "type": "integer",
      "description": "Unix-like time stamp"
    }
  }
}

Example:
{"subject":"register-sample-start","statisticid":2,"timestamp":1596219816165}
{
  "$schema": "http://json-schema.org/draft/2019-09/schema",
  "title": "AddSampleLong",
  "type": "object",
  "required": ["subject", "statistic-id", "value", "timestamp"],
  "properties": {
    "subject": {
      "type": "string",
      "description": "Always 'add-sample-long'"
    },
    "statistic-id": {
      "type": "integer",
      "description": "The unique statistic id"
    },
    "value": {
      "type": "integer",
      "description": "The measured value"
    },
    "timestamp": {
      "type": "integer",
      "description": "Unix-like time stamp"
    }
  }
}

Example:
{"subject":"add-sample-long","statisticid":2,"value":105,"timestamp":1596219842468}
{
  "$schema": "http://json-schema.org/draft/2019-09/schema",
  "title": "AddSampleError",
  "type": "object",
  "required": ["subject", "statistic-id", "error-subject", "error-severity",
  "timestamp"],
  "properties": {
    "subject": {
      "type": "string",
      "description": "Always 'add-sample-error'"
    },
    "statistic-id": {
      "type": "integer",
      "description": "The unique statistic id"
    },
    "error-subject": {
      "type": "string",
      "description": "The subject or title of the error"
    },
    "error-severity": {
      "type": "string",
      "description": "'warning' or 'error' or 'fatal'"
    },
    "error-type": {
      "type": "string",
      "description": "The type of the error. Errors which contains the same error
    type can be grouped."
    },
    "error-log": {
      "type": "string",
      "description": "The error log. Multiple lines are supported by adding \r\n line terminators."
    },
    "error-context": {
      "type": "string",
      "description": "Context information about the condition under which the error occurred. Multiple lines are supported by adding \r\n line terminators."
    },
    "timestamp": {
      "type": "integer",
      "description": "Unix-like time stamp"
    }
  }
}

Example:
{
  "subject":"add-sample-error",
  "statistic-id":2,
  "error-subject":"Connection refused (Connection refused)",
  "error-severity":"error",
  "error-type":"java.net.ConnectException",
  "error-log":"2020-08-01 21:24:51.662 | main-HTTPClientProcessing[3] | INFO | GET http://192.168.0.111/\r\n2020-08-01 21:24:51.670 | main-HTTPClientProcessing[3] | ERROR | Failed to open or reuse connection to 192.168.0.111:80 |
 java.net.ConnectException: Connection refused (Connection refused)\r\n",
  "error-context":"HTTP Request Header\r\nhttp://192.168.0.111/\r\nGET / HTTP/1.1\r\nHost: 192.168.0.111\r\nConnection: keep-alive\r\nAccept: */*\r\nAccept-Encoding: gzip, deflate\r\n",
  "timestamp":1596309891672
}
Note about the error-severity :
Implementation note: After an error has occurred, the simulated user should wait at least 100 milliseconds before continuing his activities. This is to prevent that within a few seconds several thousand errors are measured and reported to the UI
For cumulative-counter-long statistics there is no such 2-step mechanism as for ‘sample-event-time-chart’ statistics. The value can simple increased by reporting a Add Counter Long object.
{
  "$schema": "http://json-schema.org/draft/2019-09/schema",
  "title": "AddCounterLong",
  "type": "object",
  "required": ["subject", "statistic-id", "value"],
  "properties": {
    "subject": {
      "type": "string",
      "description": "Always 'add-counter-long'"
    },
    "statistic-id": {
      "type": "integer",
      "description": "The unique statistic id"
    },
    "value": {
      "type": "integer",
      "description": "The value to increment"
    }
  }
}

Example:
{"subject":"add-counter-long","statistic-id":10,"value":2111}
To update a average-and-current-value statistic the delta (difference) values of the cumulated sum and the delta (difference) of the cumulated number of values has to be reported. The platform calculates then the average value by dividing the cumulated sum by the cumulated number of values. In addition, the last measured value must also be reported.
{
  "$schema": "http://json-schema.org/draft/2019-09/schema",
  "title": "AddAverageDeltaAndCurrentValue",
  "type": "object",
  "required": ["subject", "statistic-id", "sumValuesDelta", "numValuesDelta", "currentValue", "currentValueTimestamp"],
  "properties": {
    "subject": {
      "type": "string",
      "description": "Always 'add-average-delta-and-current-value'"
    },
    "statistic-id": {
      "type": "integer",
      "description": "The unique statistic id"
    },
    "sumValuesDelta": {
      "type": "integer",
      "description": "The sum of delta values to add to the average"
    },
    "numValuesDelta": {
      "type": "integer",
      "description": "The number of delta values to add to the average"
    },
    "currentValue": {
      "type": "integer",
      "description": "The current value, or -1 if no such data is available"
    },
    "currentValueTimestamp": {
      "type": "integer",
      "description": "The Unix-like timestamp of the current value, or -1 if no such data is available"
    }
  }
}

Example:
{
  "subject":"add-average-delta-and-current-value",
  "statistic-id":100005,
  "sumValuesDelta":6302,
  "numValuesDelta":22,
  "currentValue":272,
  "currentValueTimestamp":1634401774374
}
To update a efficiency-ratio-percent statistic, the delta (difference) of the number of efficient performed procedures and the delta (difference) of the number of inefficient performed procedures has to be reported.
{
  "$schema": "http://json-schema.org/draft/2019-09/schema",
  "title": "AddEfficiencyRatioDelta",
  "type": "object",
  "required": ["subject", "statistic-id", "efficiencyDeltaValue", "inefficiencyDeltaValue"],
  "properties": {
    "subject": {
      "type": "string",
      "description": "Always 'add-efficiency-ratio-delta'"
    },
    "statistic-id": {
      "type": "integer",
      "description": "The unique statistic id"
    },
    "efficiencyDeltaValue": {
      "type": "integer",
      "description": "The number of efficient performed procedures to add"
    },
    "inefficiencyDeltaValue": {
      "type": "integer",
      "description": "The number of inefficient performed procedures to add"
    }
  }
}

Example:
{
  "subject":"add-efficiency-ratio-delta",
  "statistic-id":100006,
  "efficiencyDeltaValue":6,
  "inefficiencyDeltaValue":22
}
To update a throughput-time-chart statistic, the delta (difference) value from a last absolute, cumulated value to the current cumulated value has to be reported, whereby the current time stamp is included in the calculation.
Although this type of statistic always has the unit throughput per second, a measured delta (difference) value can be reported at any time.
{
  "$schema": "http://json-schema.org/draft/2019-09/schema",
  "title": "AddThroughputDelta",
  "type": "object",
  "required": ["subject", "statistic-id", "delta-value", "timestamp"],
  "properties": {
    "subject": {
      "type": "string",
      "description": "Always 'add-throughput-delta'"
    },
    "statistic-id": {
      "type": "integer",
      "description": "The unique statistic id"
    },
    "delta-value": {
      "type": "number",
      "description": "the delta (difference) value"
    },
    "timestamp": {
      "type": "integer",
      "description": "The Unix-like timestamp of the delta (difference) value"
    }
  }
}

Example:
{
  "subject":"add-throughput-delta",
  "statistic-id":100003,
  "delta-value":0.53612,
  "timestamp":1634401774410
}
Add an error to the test result.
{
  "$schema": "http://json-schema.org/draft/2019-09/schema",
  "title": "AddError",
  "type": "object",
  "required": ["subject", "statistic-id", "error-subject", "error-severity",
  "timestamp"],
  "properties": {
    "subject": {
      "type": "string",
      "description": "Always 'add-error'"
    },
    "statistic-id": {
      "type": "integer",
      "description": "The unique statistic id, or -1 if this error is not bound to any statistic"
    },
    "error-subject": {
      "type": "string",
      "description": "The subject or title of the error"
    },
    "error-severity": {
      "type": "string",
      "description": "'warning' or 'error' or 'fatal'"
    },
    "error-type": {
      "type": "string",
      "description": "The type of the error. Errors which contains the same error type can be grouped."
    },
    "error-log": {
      "type": "string",
      "description": "The error log. Multiple lines are supported by adding \r\n line terminators."
    },
    "error-context": {
      "type": "string",
      "description": "Context information about the condition under which the error occurred. Multiple lines are supported by adding \r\n line terminators."
    },
    "timestamp": {
      "type": "integer",
      "description": "Unix-like time stamp"
    }
  }
}

Example:
{
  "subject":"add-error",
  "statistic-id":-1,
  "error-subject":"Connection refused (Connection refused)",
  "error-severity":"error",
  "error-type":"java.net.ConnectException",
  "error-log":"2020-08-01 21:24:51.662 | main-HTTPClientProcessing[3] | INFO | GET http://192.168.0.111/\r\n2020-08-01 21:24:51.670 | main-HTTPClientProcessing[3] | ERROR | Failed to open or reuse connection to 192.168.0.111:80 |
 java.net.ConnectException: Connection refused (Connection refused)\r\n",
  "error-context":"HTTP Request Header\r\nhttp://192.168.0.111/\r\nGET / HTTP/1.1\r\nHost: 192.168.0.111\r\nConnection: keep-alive\r\nAccept: */*\r\nAccept-Encoding: gzip, deflate\r\n",
  "timestamp":1596309891672
}
Note: Do not use this error object for sample-event-time-chart(s).
Add an annotation event to the test result.
{
  "$schema": "http://json-schema.org/draft/2019-09/schema",
  "title": "AddTestResultAnnotationExecEvent",
  "type": "object",
  "required": ["subject", "event-id", "event-text", "timestamp"],
  "properties": {
    "subject": {
      "type": "string",
      "description": "Always 'add-test-result-annotation-exec-event'"
    },
    "event-id": {
      "type": "integer",
      "description": "The event id, valid range: -1 .. -999999"
    },
    "event-text": {
      "type": "string",
      "description": "the event text"
    },
    "timestamp": {
      "type": "integer",
      "description": "The Unix-like timestamp of the event"
    }
  }
}

Example:
{
  "subject":"add-test-result-annotation-exec-event",
  "event-id":-1,
  "event-text":"Too many errors: Test job stopped by plug-in",
  "timestamp":1634401774410
}
Notes:
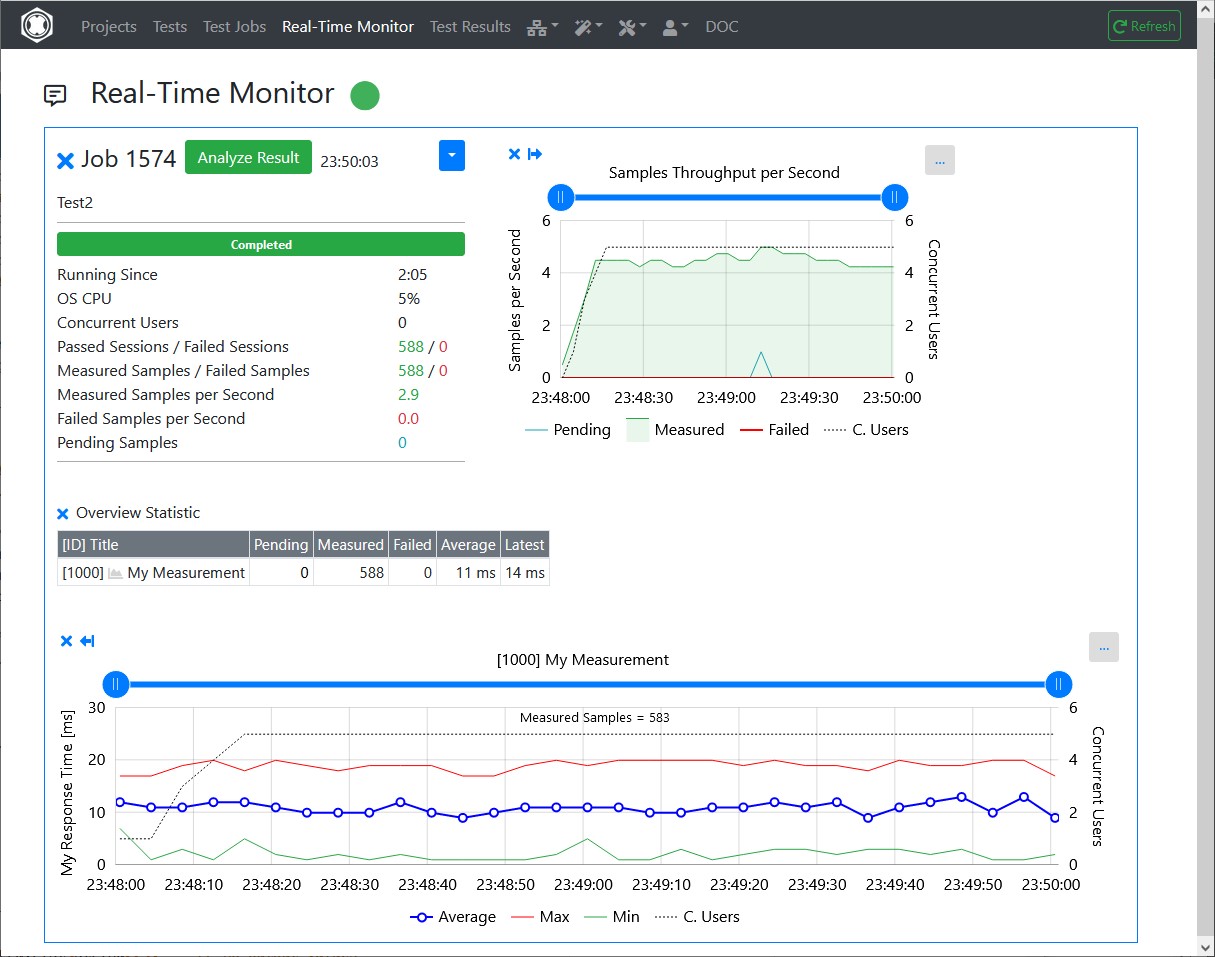
This plug-in “measures” a random value, and is executed in this example as the only part of an HTTP Test Wizard session.
The All Purpose Interface JSON objects are written using the corresponding methods of the com.dkfqs.tools.javatest.AbstractJavaTest class. This class is located in the JAR file com.dkfqs.tools.jar which is already predefined for all plug-ins.
import com.dkfqs.tools.javatest.AbstractJavaTest;
import com.dkfqs.tools.javatest.AbstractJavaTestPluginContext;
import com.dkfqs.tools.javatest.AbstractJavaTestPluginInterface;
import com.dkfqs.tools.javatest.AbstractJavaTestPluginSessionFailedException;
import com.dkfqs.tools.javatest.AbstractJavaTestPluginTestFailedException;
import com.dkfqs.tools.javatest.AbstractJavaTestPluginUserFailedException;
import com.dkfqs.tools.logging.LogAdapterInterface;
import java.util.ArrayList;
import java.util.List;
// add your imports here

/**
 * HTTP Test Wizard Plug-In 'All Purpose Interface Example'.
 * Plug-in Type: Normal Session Element Plug-In.
 * Created by 'DKF' at 24 Sep 2021 22:50:04
 * DKFQS 4.3.22
 */
@AbstractJavaTestPluginInterface.PluginResourceFiles(fileNames={"com.dkfqs.tools.jar"})
public class AllPurposeInterfaceExample implements AbstractJavaTestPluginInterface {
	private LogAdapterInterface log = null;

	private static final int STATISTIC_ID = 1000;
	private AbstractJavaTest javaTest = null;       // refrence to the generated test program

	/**
	 * Called by environment when the instance is created.
	 * @param log the log adapter
	 */
	@Override
	public void setLog(LogAdapterInterface log) {
		this.log = log;
	}

	/**
	 * On plug-in initialize. Called when the plug-in is initialized. <br>
	 * Depending on the initialization scope of the plug-in the following specific exceptions can be thrown:<ul>
	 * 	<li>Initialization scope <b>global:</b> AbstractJavaTestPluginTestFailedException</li>
	 * 	<li>Initialization scope <b>user:</b> AbstractJavaTestPluginTestFailedException, AbstractJavaTestPluginUserFailedException</li>
	 * 	<li>Initialization scope <b>session:</b> AbstractJavaTestPluginTestFailedException, AbstractJavaTestPluginUserFailedException, AbstractJavaTestPluginSessionFailedException</li>
	 * </ul>
	 * @param javaTest the reference to the executed test program, or null if no such information is available (in debugger environment)
	 * @param pluginContext the plug-in context
	 * @param inputValues the list of input values
	 * @return the list of output values
	 * @throws AbstractJavaTestPluginSessionFailedException if the plug-in signals that the 'user session' has to be aborted (abort current session - continue next session)
	 * @throws AbstractJavaTestPluginUserFailedException if the plug-in signals that the user has to be terminated
	 * @throws AbstractJavaTestPluginTestFailedException if the plug-in signals that the test has to be terminated
	 * @throws Exception if an error occurs in the implementation of this method
	 */
	@Override
	public List<String> onInitialize(AbstractJavaTest javaTest, AbstractJavaTestPluginContext pluginContext, List<String> inputValues) throws AbstractJavaTestPluginSessionFailedException, AbstractJavaTestPluginUserFailedException, AbstractJavaTestPluginTestFailedException, Exception {
		// log.message(log.LOG_INFO, "onInitialize(...)");

		// --- vvv --- start of specific onInitialize code --- vvv ---
		if (javaTest != null) {
		    this.javaTest = javaTest;

		    // declare the statistic
		    javaTest.declareStatistic(STATISTIC_ID,
            		                  AbstractJavaTest.STATISTIC_TYPE_SAMPLE_EVENT_TIME_CHART,
            		                  "My Measurement",
            		                  "",
            		                  "My Response Time",
            		                  "ms",
            		                  STATISTIC_ID,
            		                  true,
            		                  "");
		}
		// --- ^^^ --- end of specific onInitialize code --- ^^^ ---

		return new ArrayList<String>();		// no output values
	}

	/**
	 * On plug-in execute. Called when the plug-in is executed. <br>
	 * Depending on the execution scope of the plug-in the following specific exceptions can be thrown:<ul>
	 * 	<li>Initialization scope <b>global:</b> AbstractJavaTestPluginTestFailedException</li>
	 * 	<li>Initialization scope <b>user:</b> AbstractJavaTestPluginTestFailedException, AbstractJavaTestPluginUserFailedException</li>
	 * 	<li>Initialization scope <b>session:</b> AbstractJavaTestPluginTestFailedException, AbstractJavaTestPluginUserFailedException, AbstractJavaTestPluginSessionFailedException</li>
	 * </ul>
	 * @param pluginContext the plug-in context
	 * @param inputValues the list of input values
	 * @return the list of output values
	 * @throws AbstractJavaTestPluginSessionFailedException if the plug-in signals that the 'user session' has to be aborted (abort current session - continue next session)
	 * @throws AbstractJavaTestPluginUserFailedException if the plug-in signals that the user has to be terminated
	 * @throws AbstractJavaTestPluginTestFailedException if the plug-in signals that the test has to be terminated
	 * @throws Exception if an error occurs in the implementation of this method
	 */
	@Override
	public List<String> onExecute(AbstractJavaTestPluginContext pluginContext, List<String> inputValues) throws AbstractJavaTestPluginSessionFailedException, AbstractJavaTestPluginUserFailedException, AbstractJavaTestPluginTestFailedException, Exception {
		// log.message(log.LOG_INFO, "onExecute(...)");

		// --- vvv --- start of specific onExecute code --- vvv ---
		if (javaTest != null) {

		    // register the start of the sample
		    javaTest.registerSampleStart(STATISTIC_ID);

		    // measure the sample
		    final long min = 1L;
		    final long max = 20L;
		    long responseTime = Math.round(((Math.random() * (max - min)) + min));

		    // add the measured sample to the statistic
		    javaTest.addSampleLong(STATISTIC_ID, responseTime);

		    /*
		    // error case
		    javaTest.addSampleError(STATISTIC_ID,
                                    "My error subject",
                                    AbstractJavaTest.ERROR_SEVERITY_WARNING,
                                    "My error type",
                                    "My error response text or log",
                                    "");
            */
		}
		// --- ^^^ --- end of specific onExecute code --- ^^^ ---

		return new ArrayList<String>();		// no output values
	}

	/**
	 * On plug-in deconstruct. Called when the plug-in is deconstructed.
	 * @param pluginContext the plug-in context
	 * @param inputValues the list of input values
	 * @return the list of output values
	 * @throws Exception if an error occurs in the implementation of this method
	 */
	@Override
	public List<String> onDeconstruct(AbstractJavaTestPluginContext pluginContext, List<String> inputValues) throws Exception {
		// log.message(log.LOG_INFO, "onDeconstruct(...)");

		// --- vvv --- start of specific onDeconstruct code --- vvv ---
		// no code here
		// --- ^^^ --- end of specific onDeconstruct code --- ^^^ ---

		return new ArrayList<String>();		// no output values
	}

}

This example shows a JUnit Test that executes a DNS query to resolve and verify a hostname of a domain.