Synthetic Monitoring
Synthetic Monitoring is an essential part of Digital Experience Monitoring, where organizations can detect their service outages or performance degrade proactively by periodically running the tests.
RealLoad provides an easy way of configuring synthetic tests with an outcome of accurate metrics, alerting and SLA details.
RealLoad Synthetic Monitoring Features
- Due to the universal architecture, RealLoad Tests of any kind can be run as a Monitoring Job (HTTP Test Wizard tests, JUnit tests, Selenium IDE tests).
- Monitoring Jobs can be assigned to multiple Measuring Agents, which means that the job is executed from different geographical locations. The measurement results of the Measuring Agents are combined into a single result, whereby the individual result of each Measuring Agent is still available.
- Support for performance warning thresholds.
- Support for delayed alarm notifications.
- Supported alert devices: Email, Mobile Companion App (installed on a mobile phone), SMS and WebHooks (including Pagerduty and Slack).
- Synthetic monitoring jobs can also run with hundreds of virtual users ¹
¹ = does not apply to Selenium IDE and Playwright Tests (max. 5..50 users per Measuring Agent due to the high CPU usage) - Custom dashboards can be created for third-party products like Grafana using the WebSocket API.
Prerequisite: Define a Test
You have first to define a RealLoad ‘Test’ before you can add it to Synthetic Monitoring.
Configure Synthetic Monitoring
First add a Monitoring Group and then add one or more Monitoring Jobs to the Monitoring Group. If you want to run Monitoring Jobs with different intervals, you can also define several Monitoring Groups. Measuring Agents will be available for selection based on how many agents are already configured on different geographical locations.
Add Monitoring Group


Input Fields:
- Group Title : Must be unique across all monitoring groups.
- Group Description : Optional description.
- Max. Data Storage Time : The maximum retention period of the measured data.
- Execution Interval : The execution interval of the Monitoring Jobs.
- Execution Timeout : The execution timeout of the Monitoring Group. Tip: do not choose this too short, otherwise the Monitoring Jobs will be aborted. The execution timeout can also be greater than the execution interval. The monitoring jobs of a monitoring group are executed in sequential order.
- Primary Measuring Agent & Additional Measuring Agents : Select the Measuring Agent(s) on which the Monitoring Jobs will be executed.
After you have added a monitoring group, its execution is switched off. Switch on the execution now:

Add Monitoring Job
In a Monitoring Group, first click on ‘Monitoring Jobs’ and then in the Monitoring Jobs area on ‘Add Monitoring Job’:

Then select a Test …

… And Configure and Define the Monitoring Job:

Input Fields:
- Monitoring Job Title : Required.
- Monitoring Job Description : Optional description.
- Job Execution Enabled : Controls whether the job is executed.
- Number of Users : The number of simulated users that are started.
- Max. Test Duration : The maximum test duration.
- Max. Loops per User : The maximum number of sessions executed per user (the number of iterations of the test per user).
- Loop Iteration Delay : The delay time after a session of a user has ended until the next session of the user is started.
- Ramp Up Time : The length of time at the beginning of the test until all simulated users are started. Example: with 20 simulated users and a time of 10 seconds, a new user is started each 0.5 seconds.
- Additional Arguments : Additional values which are transferred on the command line when the test script is started. These arguments are test specific. For tests that were created with the “HTTP Test Wizard” you can specify for example the following values: “-tcpTimeout 8000 -sslTimeout 5000 -httpTimeout 60000” (TCP connect timeout / SSL handshake timeout / HTTP processing timeout) which are considered by the executed URL calls and override the default values.
- Debug Execution : This option effects that detailed information are written to the log file of the test. For example variable values which have been extracted from input files or from HTTP responses as well as variable values which are assigned at runtime. Only activate this option if you have problems with the execution of the test.
- Debug Measuring : Effects that the Data Collector of the Measuring Agent writes the JSON objects of the All Purpose Interface to its log file. This option can be enabled to debug self-developed tests that have been written from scratch.
- (User Input Fields) : If the test contains User Input Fields you can enter their values here.
- Performance Warning Alert Threshold : If switched on, a warning alert is triggered if the configured time per user loop (per user session) is exceeded.
- Performance Error Alert Threshold : If switched on, a error alert is triggered if the configured time per user loop (per user session) is exceeded.
Normally you do not have to enter any “Additional Arguments” and leave “Debug Execution” and “Debug Measuring” switched off.
Tip: We recommend that you leave options ‘Performance Warning Alert Threshold’ and ‘Performance Error Alert Threshold’ switched off for now and configure them later - after the new defined Monitoring Job has been running for a few hours.
The following limits apply for Monitoring Jobs which are executed on shared Measuring Agents:
- Number of Users: max. 5
- Max. Test Duration (Seconds): max. 300
- Max. Loops per User: max. 5
If you operate your own, private Measuring Agents (or have us to operate them), these limits do not apply - meaning you can run Monitoring Jobs with hundreds or thousands of concurrent users.
Alerting
Proceed as follows:
- Add one or more Alert Groups.
- Define the Alert Devices and assign them to the Alert Group(s).
- Assign the Alert Groups to Monitoring Groups and/or to Monitoring Jobs
Add Alert Group
First click on the ‘Alert Groups & Devices’ tab and then click on ‘Add Alert Group’.


Input Fields:
- Alert Group Title : Must be unique across all alert groups.
- Alert Group Description : Optional description.
- Alert Group Enabled : Controls whether the alert group is enabled or disabled.
- Report Measured Errors : Controls whether errors measured by monitoring jobs are reported.
- Report Measured Warnings : Controls whether warnings measured by monitoring jobs are reported.
- Report System Failures : Controls whether malfunctions of the monitoring system are reported (for example if a Measuring Agent is not reachable).
- Report Execution Failures : Controls whether execution failures of monitoring jobs on Measuring Agents are reported (meaning that the start of the corresponding test job failed).
- Repeat Alerts : Controls whether the alerts for the same issue are reported repeatedly.
- Report Alerts ‘Instantly’ or ‘After n Repeat’ : Controls whether alerts are reported immediately or delayed.
Tip: For example, you can define two alert groups, one for operations and another for developers. In the developer alert group, you could turn off the switches ‘Report System Failures’ and ‘Report Execution Failures’.
Add Alert Devices
First expand the area of the alert device type and then click the ‘+’ icon:


After adding the alert device, you should test it:


Assign Alert Device to Alert Groups
After an Alert Device has been added, you can assign it to one or more Alert Groups.


Assign Alert Groups to Monitoring Groups and Monitoring Jobs
To receive Alert Notifications, you must assign the Alert Groups to Monitoring Groups and/or to Monitoring Jobs.

If you click on a bell icon you can only assign one Alert Group. However, you can click the bell icon multiple times to assign multiple Alert Groups.
Real-Time Dashboard
As the name suggests, the current values of the Monitoring Groups and Monitoring Jobs are displayed in real time. The current time, which is received from the portal server, is also shown at the top right. To get a slightly more reduced view, you can also only display the Monitoring Jobs.

Values Displayed:
- System Status (‘Healthy’, ‘Partial Malfunction’, or ‘Malfunction’) : Indicates whether there are malfunctions in the monitoring system (for example if a measuring agent is not reachable).
- Execution State (‘Successful’, ‘Partial Failed’, or ‘Failed’) : Indicates whether execution failures of monitoring jobs on measuring agents are occurred (meaning that the start of the test job failed).
- Availability Last 24hr : The measured availability within the last 24 hours. When you click on the value, the corresponding statistics are displayed. The sparkline (micro chart) shows the availability of the last 24 hours.
- Errors | Warnings : The number of measured errors and warnings of the last execution. If you click on the chart icon, the details of the last measurement result are displayed.
- Last Executed : The date and time of the last execution. If you click on the file icon, the log file of the last test execution as well as the detailed measurement results of the individual measuring agents are displayed.
- Performance : The measured time duration per successfully executed loop or per user session of the last execution of the monitoring job. The sparkline (micro chart) shows the performance of the last 24 hours.
Display the Latest Test Result
In a Monitoring Job click the ‘Test Result’ icon. The browser will now be redirected to the Tests Results Menu and the test result will be loaded.

If errors or warnings were measured, you can view their details:

If the test was performed without errors, the test result would look like this:

Display the Latest Job Log Files
In a Monitoring Job click the ‘Job Output Files’ icon to display the latests job log and output files.

In this example, the monitoring job was configured to be executed from two Measuring Agents:

Statistics, SLA Verification and Historical Data
Click the Statistics Tab to view the data and charts about the measured availability and performance of a Monitoring Group or Monitoring Job.
By selecting a suitable Time Range, you can check whether the SLA requirements have been met.
Proceed as follows:
- Select a Monitoring Group.
- Select a Monitoring Job (of the Monitoring Group).
- Select the Time Range.
- Click ‘Apply’.
- Optional: Click inside a chart to get access to the historical data of a specific Monitoring Job execution.
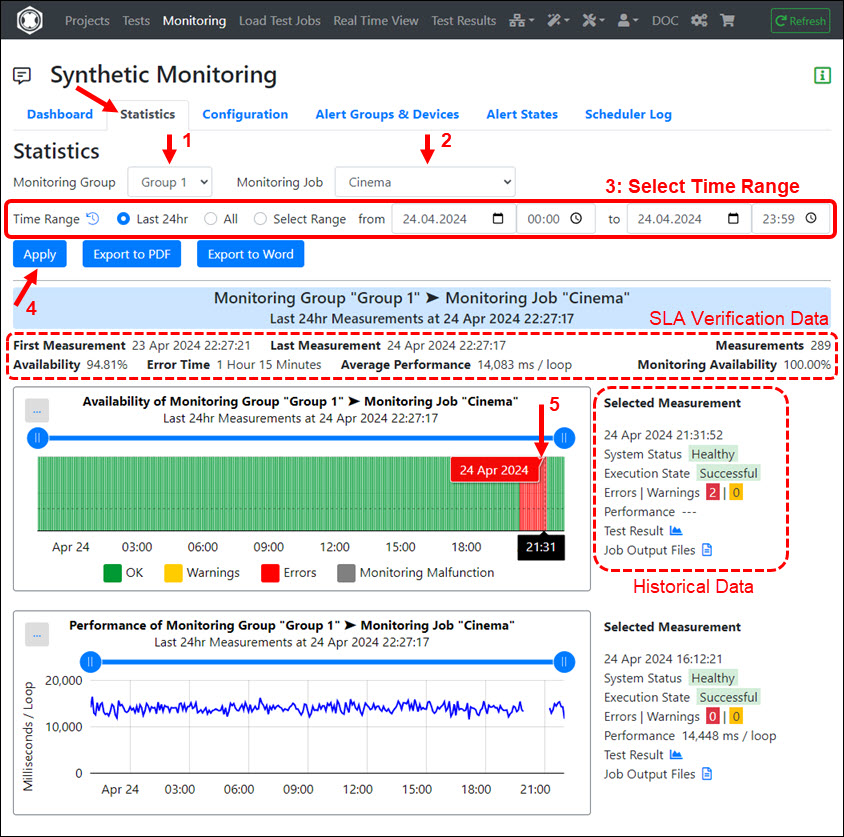
Values Displayed:
- First Measurement : The absolute date/time when the first Monitoring Job was executed in the selected time range.
- Last Measurement : The absolute date/time when the last Monitoring Job was executed in the selected time range.
- Measurements : The number of Monitoring Jobs executed in the selected time range.
- Availability : The error-free availability of the Monitoring Job calculated in the selected time range.
- Error Time : The cumulative time that errors were measured in the selected time range.
- Average Performance : The average time per executed loop (per session loop) of the Monitoring Job in the selected time range.
- Monitoring Availability : The (internal) availability of the RealLoad Monitoring System in the selected time range.